Should different countries participating in PISA
interpret socioeconomic background in the same way? A measurement invariance
approach
Nurullah
Eryilmaz 1 ![]() ; Mauricio
Rivera-Gutiérrez 2
; Mauricio
Rivera-Gutiérrez 2 ![]() ; Andrés Sandoval-Hernández 1
; Andrés Sandoval-Hernández 1 ![]()
1 University of Bath, United Kingdom;
2 University of Brighton, United Kingdom
Abstract. It has
been claimed that there is a lack of theory-driven constructs and a lack of
cross-country comparability in International Large-Scale Assessment (ILSA)’s
socio-economic background scales. To address these issues, a new socio-economic
background scale was created based on Pierre Bourdieu’s cultural reproduction
theory, which distinguishes economic, cultural and social capital. Secondly,
measurement invariance of this construct was tested across countries
participating in the Programme for International Student Assessment (PISA).
After dividing the countries which participated in PISA 2015 into three groups,
i.e., Latin American, European, and Asian, a Multi-Group Confirmatory Factor
Analysis was carried out in order to examine the measurement invariance of this
new socio-economic scale. The results of this study revealed that this
questionnaire, which measures the socio-economic background, was not found to
be utterly invariant in the analysis involving all countries. However, when
analysing more homogenous groups, measurement invariance was verified at the
metric level, except for the group of Latin American countries. Further,
implications for policymakers and recommendations for future studies are
discussed.
Keywords:
measurement invariance; multi-group confirmatory factor analysis; cultural
reproduction theory; Pierre Bourdieu; socio-economic scales; PISA
¿Los países que participan en PISA deberían interpretar por igual el ambiente socioeconómico? Un enfoque de medición de invariancia
Resumen. Se ha argumentado que existe una falta de interpretaciones basadas en teorías, junto con una falta de comparabilidad entre países en las escalas de ambientes socioeconómicos de las evaluaciones internacionales a gran escala (ILSA, por sus siglas en inglés). A fin de dar respuesta a estos asuntos, se ha creado una nueva escala de ambiente socioeconómico basada en la teoría de reproducción cultural de Pierre Bourdieu, que distingue capital económico, cultural y social. En segundo lugar, la invariancia de medición de esta interpretación se ha probado en distintos países que participaron en PISA 2015 en tres grupos, es decir, se ha llevado a cabo un Análisis de Factor Confirmatorio Multigrupo de América Latina, Europa y Asia para examinar la medición de la variancia de esta nueva escala socio-económica. Los resultados han puesto de manifiesto que este cuestionario, que mide el ambiente socioeconómico, no es totalmente invariante en el análisis en relación con todos los países. No obstante, al analizar grupos más homogéneos, la invariancia de la medición se ha verificado a nivel métrico, salvo para el grupo de países de Latinoamérica. Además, se han debatido las implicaciones para el legislador junto con las recomendaciones para estudios futuros.
Palabras clave: invariancia de medición; análisis de factor confirmatorio multigrupo; teoría de reproducción cultural; Pierre Bourdieu; escalas socio-económicas; PISA.
Os países participantes do PISA deveriam interpretar o ambiente socioeconômico de maneira igual? Uma abordagem de medição de invariância
Resumo. Argumentou-se que há uma falta de interpretações baseadas em teorias, juntamente com uma falta de comparabilidade entre países nas escalas de ambientes socioeconômicos das avaliações internacionais em grande escala (ILSA, em sua sigla em inglês). Para responder a essas questões, uma nova escala de ambiente socioeconômico foi criada com base na teoria da reprodução cultural de Pierre Bourdieu, que distingue o capital econômico, cultural e social. Em segundo lugar, a invariância de medição dessa interpretação foi testada em diferentes países que participaram do PISA 2015 em três grupos, ou seja, realizou-se uma Análise de Fator Confirmatório Multigrupo da América Latina, Europa e Ásia para examinar a medição da variância desta nova escala socioeconômica. Os resultados mostraram que este questionário, que mede o ambiente socioeconômico, não é totalmente invariável na análise em relação a todos os países. Porém, ao analisar grupos mais homogêneos, verifica-se a invariância da medição em nível métrico, exceto para o grupo de países América Latina. Além disso, as implicações para o legislador foram discutidas juntamente com as recomendações para estudos futuros.
Palavras-chave: invariância de medição; análise fatorial confirmatória multigrupo; teoria da reprodução cultural; Pierre Bourdieu; escalas socioeconômicas; PISA.
1
Introduction
International
Large-Scale Assessments (ILSAs) have been given much attention due to the
ever-increasing participation rate across countries in the world (Addey,
Sellar, Steiner-Khamsi, Lingard & Verger, 2017). Retrospectively speaking,
the International Association for the Evaluation of Educational Achievement
(IEA) carried out the first ILSA in 1960, with the participation of twelve
pilot countries (Addey & Sellar, 2018). By the end of the 1990s, the number
of participating countries was approximately 40 (Tijana & Anna, 2015).
Nowadays, nearly 70% of countries across the world participate in these
evaluations (Lietz, Cresswell, Rust & Adams, 2017). Table 1 shows a
selection of recent ILSAs and the respective number of participating countries
for reference.
Table 1. Recent ILSA studies
|
ILSA studies |
Participation |
|
PISA 2018 |
79 countries, 37 OECD member countries |
|
TIMSS 2015 |
57 countries and 7 benchmarking entities |
|
PIRLS 2016 |
61 participants (50 countries and 11 benchmarking) |
|
ICCS 2016 |
24 countries around the world |
|
PASEC 2014 |
10
countries in Francophone West Africa |
|
SACMEQ 2013 |
15 ministries of education |
|
TERCE 2013 |
15
participants (14 countries and 1 Mexican state) |
|
ERCE 2019 |
19 countries |
The OECD’s
Programme for International Student Assessment (PISA) shows the highest number
of participating countries, compared to other ILSAs. Participation in PISA has
also significantly increased over time. In 2000, 43 countries participated in
this assessment, whereas 72 took part in 2015, and 80 in the latest round which
took place in 2018 (Steiner-Khamsi, 2019). Since 2000, the proportion of
countries participating in PISA has almost doubled worldwide.
There are
two main objectives behind the application of ILSA studies: contributing
comparatively to the functioning of educational systems, as well as
illuminating the development of educational and training programmes in
participating countries from many diverse regions (Torney-Purta & Amadeo,
2013). In this context, ILSAs introduce a major challenge relating to
comparability, in that their underlying tools should enable sensible
cross-country comparisons to comply with their aims (Goldstein, 2017; Segeritz
& Pant, 2013).
The design
process of ILSAs requires to adhere to rigorous standards to make comparisons
possible across a wide range of participants, which are diverse in terms of
culture, and economic and political contexts (Miranda & Castillo, 2018).
Results of these assessments should be comparable because, as Mullis (2002, p.
2) states, they “provide an opportunity to examine the impact on achievement of
different educational approaches and additional insight into ones’ educational
system”. To meet these requirements, measurement instruments should ensure that
participants who hold the same level of a certain characteristic obtain the
same score in the test.
It is in
this context that measurement invariance becomes a key condition that needs to
be verified in these studies. The design and implementation of measurement
instruments should allow all countries participating in ILSAs to be reflected
in an equal manner. Measurement invariance should be taken into account as a
significant matter in order to make group comparisons, that is to say, only if
measurement invariance is ensured, then researchers can make comparisons
between different cultures (Van de Vijver & Leung, 1997; Van de Vijver
& Poortinga, 2002; Byrne & Van de Vijver, 2010). To put it differently,
as long as a given scale’s measurement invariance is confirmed among relevant
groups, scores obtained from it can be used to make a comparison across groups
(Uysal & Arıkan, 2018). Conversely, if measurement invariance is not
verified, both the validity of the scores and interpretations, and the fairness
of the measurement process remain disputable (Gregorich, 2006). As a natural
consequence of this, interpretations, and conclusions about group differences
across countries may not be valid (Cheung and Rensvold, 2002).
The
question on cross-cultural comparability of cognitive assessments in ILSAs has
had considerable attention in the literature (e.g. Wu, 2010; Klieme, 2016 &
Oliveri & Ercikan, 2011). Numerous studies have addressed the question of
measurement invariance for PISA cognitive assessments, while less attention has
been paid to PISA context questionnaires (Van de Vijver, 2018) (i.e. student
questionnaires, e.g. He et al., 2018). Although Hopfenbeck et al. (2018)
explicitly states that measurement invariance is just as important for
background questionnaires, Rutkowski and Rutkowski (2010) highlight that for
all participating countries, background questionnaires comparability has not
been explored to the same extend as the cognitive assessments. Despite this, background
questionnaire responses from participants are still utilized to make
approximate estimations of the population and subpopulation achievements by
using linear regression models (Rutkowski & Rutkowski, 2010). In light of
this, ‘the degree to which a single measure of socioeconomic background is
reliable and valid for all participating countries is not widely discussed’
(Rutkowski & Rutkowski, 2013, p. 260).
Socioeconomic
status (SES) is one of the most frequently used predictive factors of academic
achievement in the literature (Sirin, 2005; White, 1982). The socioeconomic
background of students has increasingly become essential in educational
research to determine whether there is segregation, differences, or
inequalities between students in ILSAs, especially in PISA. In fact, this
aspect is included in the fourth United Nation’s Sustainable Development Goal
(SDG4; UN, 2015), which aims to ensure inclusive and equitable quality
education and promote opportunities for all students. After the study of Coleman
et al. (1966), the link between socio-cultural and economic status and academic
achievement has been demonstrated. To date, it has been clearly stated that SES
is of great importance as an indicator. It has been integrated to studies on
students’ educational outcomes as a supplementary component (Bornstein &
Bradley, 2003; White, 1982; Neff, 1938; Bradley & Corwyn, 2002; Sirin,
2005). For instance, Sirin (2005) review’s findings highlighted that student’s
educational achievement is significantly affected by the socio-economic
structure of families.
There are
numerous studies addressing the association between SES and student academic
achievement in the context of cross-cultural studies, particularly using PISA
data (e.g., Park & Sandefur, 2016; Thein & Ong, 2015; Kalaycioglu,
2015; Pokropek et al. 2015). Nonetheless, there have been two fundamental
criticisms regarding the use of SES in PISA, particularly when addressing
questions on socio-economic unevenness: the lack-of-theory issue, and the problem
of comparability. First, it is critical to note that, in general, decisions
about what will be included in ILSA studies are made without taking into
account existing theories, and analyses tend to only draw on statistical
measures, such as correlations and regression models (Lauder et al. 1998; Coe
& Fitz-Gibbon 1998). In that sense, the need to consolidate and understand
the theoretical frame regarding socio-cultural and economic status as measured
in ILSAs has emerged. Second, there is a fundamental debate as to whether SES
has the same meaning across countries, particularly in terms of the indicators
measuring this construct (Rutkowski & Rutkowski, 2013). This is a question
on the validity of the interpretations made around SES and whether it can be
measured across countries that have diverse contexts and conditions. Pokropek
et al. (2017) gave an illustrative example in this point:
Having a
car may not indicate socioeconomic status in the same way in the United States
as it does in Japan. While in the United States car ownership is virtually
universal (because distances between locations are large and the costs of
maintaining a car low), in Japan car ownership is less common even in
relatively wealthy families (as public transportation is widespread and efficient,
and the cost of maintaining a car is high (p.244).
In order to
address the first of the abovementioned criticisms, this paper aims to obtain
and establish experimental confirmation for Pierre Bourdieu’s cultural
reproduction theory in order to theoretically support PISA’s socio-economic
status construct. This will be done by constructing one scale which does not
originally exist in PISA in accordance with this theory. Cultural reproduction
theory will be explained in detail in the literature review section.
Secondly,
this paper aims to test the measurement invariance of the socioeconomic status
construct across countries participating in PISA 2015 (OECD, 2018). When we
look at the structure of PISA 2015, it can easily be stated that participating
countries comprise of a wide range of populations, which includes different
cultures, economic systems, and diverse spoken languages. The measurement
invariance of PISA’s SES structure has been tested across all countries but has
not been properly confirmed (e.g., Rutkowski & Rutkowski, 2013; Pokropek et
al., 2017)
To make
cross-group comparisons more logical and reasonable, and based on the formation
of more homogeneous groups, PISA 2015 participating countries will be split
into three groups, i.e., Latin America, Asia, and Europe, considering the
regions they belong to. While dividing the participating countries into three
geographical groups, countries with similar cultural, historical and
macroeconomic backgrounds were considered as a single group.
In summary,
this paper intends to give theoretical support to the socio-economic status
construct in PISA and, consequently, to verify whether this scale shows
measurement equivalence across PISA participating countries. Therefore, this
study aims to illustrate whether the questionnaire designed to measure the
socioeconomic background of students who participated in PISA 2015 represents
the same meaning across countries, particularly when grouped according to their
region/continent. The results of this study will provide valuable information
to improve those measures relating to concepts like socioeconomic status and
the methods currently used to analyse its association with educational
outcomes. National and local governments, as well as international organisations
in charge of implementing this kind of assessments could be the main
beneficiaries of the conclusions developed in this research.
2.
Literature review
This
section looks to address firstly the current lack of theory supporting ILSAs’
SES constructs, particularly in works that use PISA data (Caro & Cortes,
2012) and, secondly, the lack of evidence supporting cross-cultural comparisons
of these constructs. Hence, the literature will be organised around two main
topics: (1) Pierre Bourdieu’s cultural reproduction theory, (2) cross-cultural
research works using SES indicators in ILSAs. Cultural reproduction theory will
be discussed because a connection will be established between this theory and
our proposed SES construct. Cross-cultural research using ILSA data will be
reviewed in order to show the lack of empirical evidence to sustain the
validity of comparison of SEs constructs across countries.
2.1 Cultural Reproduction Theory of
Pierre Bourdieu
SES is
described as a structure resulting from the combination of many components
based on social, cultural, and economic factors such as individual’s education
level, household income, occupation, and home possessions. In the same way, the
concept of capital pointed out by Bourdieu (1986) and Coleman (1988), expressed
as three types of capital, i.e., economic, cultural and social, has been used
in studies by most researchers to reveal the possible association between the
family’s socio-economic status and students’ academic achievement. Capital is defined
as a notion that “takes time to accumulate and which, as a potential capacity
to produce profits and to reproduce itself in identical or expanded form,
contains a tendency to persist in its being” (Bourdieu, 1986, p. 241).
Three forms
of capital can be identified (Bourdieu 1986, p.242): economic capital, “which
is immediately and directly convertible into money and might be
institutionalized in the form of property rights”; cultural capital, “which is
convertible, in certain conditions, into economic capital and might be
institutionalized in the form of educational qualifications”; and social
capital, “which is convertible, in certain conditions, into economic capital
and might be institutionalized in the form of a title of nobility”.
Bourdieu
(1986) highlights that economic capital is the root of the other types of
capital. In other words, cultural and social capital are a result of the
modification of economic capital. Family income might lead to resources that
allow them to participate in after-school activities as well as to reach
high-quality instructional facilities and to build linkage with others (Lareau,
2011). There are three forms of cultural capital (Bourdieu, 1997): incorporated
or embodied cultural capital, objectified cultural capital and institutionalized
cultural capital. Embodied cultural capital includes linguistic and cognitive
competencies, cultural habits and tendencies. Objectified cultural capital
contains possession and cultural goods, e.g., books, paintings.
Institutionalized cultural capital comprises formal educational qualifications
such as diplomas or certificates. It was revealed that cultural capital of
students had significant effects on academic achievement (e.g. Yang, 2003;
Barone, 2006). As DiMaggio (1982, p.190) points out: ‘[teachers] communicate
more easily with students who participate in elite cultures, give them more
attention and special assistance, and perceive them as more intelligent or
gifted than students who lack cultural capital’. Social capital is expressed as
belonging to a certain group based on the principle of recognizing and
interacting with one another (Bourdieu, 1986). One reason for the differences
in the educational level of students is the social capital produced as a result
of the connections and interactions of the families at different levels
(Rogosic & Baranovic, 2016).
There is a
growing body of PISA-related research focusing on either largely cultural
capital (Puzic et al., 2016; Puzic et al., 2018; Bodovski et al., 2017;
Pitzalis & Porcu, 2016; Tan, 2015; Marteleto & Andrade, 2013) or social
capital (Aloisi & Tymms, 2017). Furthermore, Garcia-Aracil et al. (2016)
considered social and cultural capital whereas Caro et al. (2014) considered
all three types, including economic capital. Education studies have
traditionally conceptualised social inequality as a multidimensional phenomenon
(Abel, 2008), however, most studies do not address the complex structure of
cultural, economic and social capital. At least in quantitative studies, it is
very rare to find studies where an integrated SES structure is considered. To
address this gap, in this paper we designed a model considering economic,
cultural, and social capital drawing on PISA 2015 socioeconomic background
questionnaires.
Measurement
invariance analysis has been frequently and widely used over the last decade
and continues to attract interest. During the past years, much attention has
been paid to testing measurement invariance of ILSAs’ cognitive assessments.
Wu, Li & Zumbo (2007) investigated the measurement invariance of the
mathematic test using TIMSS 1999 data across seven countries but found that
invariance was not supported. In the Italian context, Alivernini (2011) tested
the measurement invariance of PIRLS 2006’s reading literacy scale across
students’ gender and their immigration status and results showed that making
such comparisons was not empirically supported.
Recently,
studies have shifted their attention towards background questionnaires. For
example, Segeritz and Pant (2013) examined the measurement invariance of the
PISA 2003’s Students’ Approaches to Learning instrument across immigrant groups
in Germany and did not achieve all levels of invariance. In Turkey, Demir
(2017) explored the measurement invariance of students’ affective
characteristics across gender categories and found that this scale was largely
comparable between gender groups.
There is a
limited number of studies addressing the measurement invariance of the
socio-economic status indicator. In the United Kingdom, Hobbs and Vignoles
(2007) stated that Free School Meal (FSM) Eligibility, which has been commonly
used as a proxy for SES in UK educational research, has not enough supporting
evidence to make comparison across families with dissimilar characteristics. Lenkeit
et al. (2015) reveal that – using data from the Children of Immigrants
Longitudinal Survey in Four European Countries (CILS4EU) in England – there are
differences across immigrant groups in terms of the family background
construct.
With regard
to ILSA data, few studies relating to the measurement invariance of SES have
been conducted. Hansson and Gustafsson (2013) found that invariance of SES was
supported when comparing Swedish and non-Swedish populations, using TIMSS 2003
data. Rutkowski and Rutkowski (2013) found that the home possession indicator
present in PISA 2009 SES index was not comparable across the 65 participant
countries. Furthermore, Hernandez et al. (2019) explored the comparability of
different socioeconomic scales of three ILSA studies: TERCE, PISA and TIMSS.
None of the socioeconomic background scales was found to be fully invariant,
which suggested that comparisons across countries should be made with caution.
Caro,
Sandoval-Hernandez and Lüdtke (2014) highlight that, when using SES variables
for making comparisons, recommendations or comments about participating
countries, researchers should be extremely attentive and careful as comparisons
are not fully supported by the evidence. Correspondingly, Hopfenbeck et al.
(2018) emphasized in their systematic review that numerous articles suggest
policymakers and researchers be careful and cautious when using PISA data as a
valid benchmarking or informed policy-making tool.
3. Methodology
3.1 Sample
PISA is a
triennial survey which was firstly launched by the Organisation for Economic
Co-operation and Development (OECD) in 2000. The PISA 2015 study was
administered in 35 OECD and 37 non-OECD (partner) countries. PISA implements a
two-stage stratified sampling strategy. In the first stage, schools are sampled
using a probability selection on the basis of the number of students enrolled
in the school. In the second stage, a certain sample of students is randomly
selected within each school. 540.000 students took part in PISA 2015,
representing about 29 million 15-year-olds in schools of the 72 participating
countries (OECD, 2018). More detailed information of the sampling design,
including weighting procedures can be found in the PISA 2015 Technical Report
(OECD, 2017). To explore cross-cultural comparability across countries, the
current study considered 35 OECD countries and 19 partner countries (a total of
54 countries). The rest of partner countries were removed from the analysis due
to not having valuable information for some variables.
3.2 Measures
Nine
subscales included in the PISA 2015’s student questionnaire were selected to
create a new SES scale based on Pierre Bourdieu’s cultural reproduction theory.
Indexes were used as indicators rather than each individual item, except for
‘number of books’ (ST013Q01TA). Table 2 indicates the items used to develop the
new scale.
Table 2. PISA
2015 subscales used for the development of a new SES scale.
|
Code |
Name |
Description |
|
Wealth |
Family wealth possessions |
Summary
index consisting of a room of your own, internet, televisions, cars, rooms
with a bath or shower, cell phones with internet access, computers, tablet
computers, e-book readers and three country-specific items. |
|
Pared |
Parental education |
Summary
index of highest parental education schooling. |
|
Hisei |
Highest parental occupational status |
Summary
index of highest parental occupational status. |
|
Cultposs |
Cultural possessions |
Summary
index consisting of classic literature, books of poetry, works of art, books
on art, music or design, musical instrument. |
|
Hedres |
Home education resources |
Summary
index consisting of a desk to study, a quiet place to study, a computer you
can use for schoolwork, educational software, books to help with your
schoolwork, technical reference book, a dictionary. |
|
ST013Q01TA |
Number of books |
Single question asking about how many books are there in your home? 0-10 books (1), 11-25 books (2), 26-100 books (3), 101-200 books (4), 201-500 books (5), more than 500 books (6). |
|
Cooperate |
Enjoy Co-operation |
Summary
index consisting of ‘I am a good listener’, ‘I enjoy seeing my classmates be
successful’, ‘I take into account what others are interested in’, ‘I enjoy
considering different perspectives’. |
|
Cpsvalue |
Value Co-operation |
Summary
index consisting of ‘I prefer working as a part of team to working alone’, ‘I
find that teams make better decisions than individuals’, ‘I find that
teamwork raises my own efficiency’, ‘I enjoy cooperating with peers’. |
|
Emosups |
Parents Emotional Support |
Summary
index consisting of ‘My parents are interested in my school activities’, ‘My
parents support my educational efforts and achievements’, ‘My parents support
me when I am facing difficulties at school’, My parents encourage me to be
confident’. |
Table 3 shows
the respective descriptive statistics. Items were grouped into three groups
indicating whether they measure economic capital, cultural capital or social
capital.
Table 3. Descriptive statistics for the variables used
in this study
|
|
Minimum |
Maximum |
Mean |
Standard deviation |
|
|
Economic Capital |
|
||||
|
WEALTH (index) |
|
-7.635 |
4.715 |
-0.321 |
1.26 |
|
PARED (index) |
|
3 |
18 |
13.34 |
3.25 |
|
HISEI (index) |
|
11 |
89 |
50.44 |
22.36 |
|
Cultural Capital |
|
||||
|
CULTPOSS (index) |
|
-1.84 |
2.63 |
-0.05 |
0.95 |
|
HEDRES (index) |
|
-4.412 |
1.177 |
-0.178 |
1.07 |
|
ST013Q01TA |
|
1.00 |
6.00 |
2.963 |
1.46 |
|
Social Capital |
|
||||
|
COOPERATE (index) |
|
-3.33 |
2.29 |
0.05 |
1.01 |
|
CPSVALUE (index) |
|
-2.83 |
2.14 |
0.10 |
1.00 |
|
EMOSUPS (index) |
|
-3.08 |
1.10 |
-0.03 |
0.99 |
3.3 Analytical Strategy
The
psychometric characteristics of the created scale were evaluated following a
number of procedures. First, reliability (internal consistency) was evaluated
using Cronbach’s alpha coefficient (Cronbach, 1951). This coefficient ranges
from 0 to 1, with values close to 1 indicating high levels of reliability.
Second, a confirmatory factor analysis was implemented to evaluate the model
fit for each country (see more information in the results section). We then
applied a multi-group confirmatory factor analysis (MG-CFA) to examine the
model fit and cross-cultural comparability of this scale across all education
systems. Lastly, countries were split into three different sub-groups (Latin
American countries, Asian countries, and European countries) to examine the
cross-cultural comparability of this scale within more homogeneous groups.
3.3.1 Confirmatory Factor
Analysis
Models were
estimated using maximum likelihood (ML). Model fit was tested using the
Comparative Fit Index (CFI) and the Tucker-Lewis index (TLI) as goodness of fit
statistics, and the root-mean squared error of approximation (RMSEA) and the
standardized root mean-squared residual (SRMR) as residual fit statistics. It
is important to highlight that the closer the CFI and TLI values are to 1, and the
closer the RMSEA and SRMR values are to 0, the better model fit. Acceptable
model fit was given by CFI >.90; TLI > .90; RMSEA < .10; and SRMR <
0.08 as proposed by Hu and Bentler, (1999) and Rutkowski and Svetina (2014).
3.3.2 Cross-cultural Comparability
MG-CFA is a
method widely used to test measurement invariance (Widaman & Rice, 1997;
Vanderberg & Lance, 2000; Hair et al. 2010; Kline, 2011; Milfont &
Fischer, 2015). MG-CFA is a continuation of classic CFA, and it is based on
multi-group comparison. It divides the data into groups and determines the
model fit for each one of them (Kline, 2011; Bialosiewicz, Murphy & Berry,
2013). MG-CFA is also widely used to test measurement invariance, where
different levels of comparability must be explored, i.e., configural
invariance, metric invariance, and scalar invariance (Kline, 2011; Vandenberg
& Lance, 2000).
Configural
invariance constitutes the first step when testing measurement invariance. It
is associated with a model where the latent structure is equivalent across
groups (Kline, 2011), i.e., the common factors and items measuring these
factors are the same (Vandenberg & Lance, 2000). Although achieving this
level of invariance does not mean that the groups are comparable, it is a
prerequisite for testing other invariance levels (Kline, 2011).
Metric
invariance implies that each group has equal factor loadings (Kline, 2011). If
this level of invariance is verified, latent variances and covariances between
latent variables can be compared (Millsap & Olivera-Aguilar, 2012). When
metric invariance conditions are not met, that implies items/indicators do not
have the same meaning across groups (Gregorich, 2006).
Scalar
invariance must be verified after metric invariance has been tested. This level
implies that item constants/intercepts are equivalent among groups (Millsap
& Olivera-Aguilar, 2012) and that latent and observed variable means are
comparable (Kline, 2011; Gregorich, 2006). In other words, if scalar invariance
conditions are met, this will allow us to compare the level of the latent
variable among different education systems.
Finally,
strict invariance is the last level of invariance that can be tested and
implies that residual covariances are equivalent across groups (Brown, 2015).
However, this last step was not taken into account in this study as the scalar
level was considered sufficient to make meaningful comparisons of latent
factors across education systems (Meredith, 1993).
Two
approaches to test measurement invariance are generally accepted in the
literature: the chi-square (χ2) test and changes in CFI and RMSEA statistics (Byrne & Stewart,
2006; Cheung & Rensvold, 2002). In this study, Δχ2, ΔCFI, ΔRMSEA were calculated and assessed.
Using the chi-square test to decide on the overall model fit is said not to be
reasonable in this context due to the large sample sizes (Rutkowski and
Svetina, 2014). Therefore, ΔCFI and ΔRMSEA values were assessed in order to
determine metric and scalar invariance, drawing on the criteria suggested by Rutkowski
and Svetina (2014) when analysing large and variable sample sizes and a large
number of groups. To determine metric invariance, these authors provide a
slightly more liberal criterion of around -0.020 for ΔCFI and 0.030 for ΔRMSEA.
To determine scalar invariance, the traditional cut-off values were taken into
consideration, i.e., -0.010 for ΔCFI and a ΔRMSEA of 0.010.
All
analyses were executed in the R statistical software (R Core Team, 2019), using
lavaan (Rosseel, 2012), and lavaan.survey (Oberski, 2014) packages.
4. Findings
First, an
overall reliability estimate and CFA results are provided, as well as
country-level reliability estimates and CFA results for a model that consists
of economic (ECN), cultural (CLT) and social capital (SCL). Next, measurement
invariance analysis results are presented considering the three abovementioned
groups: Latin American countries, Asian countries, and European countries.
Figure 1 shows overall CFA results and Table 4 shows country-level reliability
estimates as well as country-level CFA models.
Figure 1
Measurement model including parameter estimates
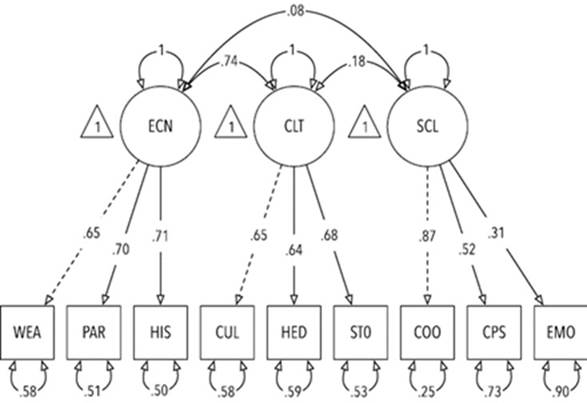
The overall
reliability was good (Cronbach’s alpha = 0.7). Factor loadings ranged from 0.31
to 0.87, error variances ranged from 0.25 to 0.90 as shown in Figure 1. Results
indicate that this model including all countries shows a weak fit to the data (χ2 = 77538.351; DF = 24; CFI = 0.893;
TLI = 0.84; RMSEA = 0.094; SRMR = 0.059). However, this model was further
considered in the analysis as it is a theory-based model.
With regard
to country-level results, reliability estimates ranged from 0.77 (BSJG China)
to 0.59 (The Netherlands). Whereas in OECD countries, the average reliability
estimate was 0.66, ranging from 0.74 to 0.59, in partner countries, the average
reliability was 0.69, ranging from 0.77 to 0.60.
Country-level
CFA models are shown in Table 4. As can be seen, no country met the minimum TLI
cut-off value of 0.90. For this reason, countries that satisfy the minimum criteria
in three of the four fit measures are shown in bold. A total of 19 nations
reached three fit measure cut-off values, of which 12 were OECD countries, and
7 were partner countries. Among the partner countries, there were three Asian
countries (Chinese Taipei, Hong Kong and BSJG China) and three Latin American
countries (Colombia, Costa Rica and the Dominican Republic), while there was
only one European country (Russian Federation). All OECD countries were
European countries, except for Korea.
Although
there are education systems with relatively adequate fit both in OECD countries
and in partner countries, there are still some education systems that do not
show a good fit to the data. This evidence does not support cultural
reproduction theory as an accurate model for some educational systems in this
study. Particularly, the model poorly fitted in Canada (CFI=0.835 and
TLI=0.752) and in New Zealand (CFI=0.826 and TLI=0.739).
Table 4. Reliability estimates and CFA results by
country
|
Educational System |
OECD |
Reliability |
CFI |
TLI |
RMSEA |
SRMR |
df |
Chi-Square |
n |
|
Australia (36) |
Yes |
0.67 |
0.855 |
0.782 |
0.087 |
0.065 |
24 |
2290.451 |
12395 |
|
Austria (40) |
Yes |
0.63 |
0.889 |
0.833 |
0.081 |
0.061 |
24 |
1019.086 |
6364 |
|
Belgium (56) |
Yes |
0.62 |
0.896 |
0.843 |
0.076 |
0.055 |
24 |
1165.708 |
8273 |
|
Brazil (76) |
No |
0.7 |
0.899 |
0.849 |
0.088 |
0.051 |
24 |
3023.911 |
16237 |
|
Bulgaria (100) |
No |
0.69 |
0.882 |
0.823 |
0.09 |
0.061 |
24 |
944.037 |
4777 |
|
Canada (124) |
Yes |
0.66 |
0.835 |
0.752 |
0.094 |
0.068 |
24 |
3698.557 |
17372 |
|
Chile (152) |
Yes |
0.74 |
0.892 |
0.838 |
0.091 |
0.054 |
24 |
1272.31 |
6240 |
|
Chinese Taipei (158) |
No |
0.72 |
0.915 |
0.873 |
0.081 |
0.063 |
24 |
1091.014 |
6726 |
|
Colombia (170) |
No |
0.7 |
0.905 |
0.858 |
0.090 |
0.043 |
24 |
2038.137 |
10321 |
|
Costa Rica (188) |
No |
0.66 |
0.913 |
0.87 |
0.086 |
0.048 |
24 |
1007.429 |
5604 |
|
Croatia (191) |
No |
0.65 |
0.897 |
0.845 |
0.081 |
0.056 |
24 |
850.098 |
5190 |
|
Czech Republic (203) |
Yes |
0.66 |
0.89 |
0.834 |
0.077 |
0.055 |
24 |
896.191 |
6067 |
|
Denmark (208) |
Yes |
0.63 |
0.918 |
0.877 |
0.065 |
0.053 |
24 |
608.497 |
5697 |
|
Dominican Rep. (214) |
No |
0.68 |
0.926 |
0.889 |
0.078 |
0.041 |
24 |
550.861 |
3636 |
|
Estonia (233) |
Yes |
0.66 |
0.882 |
0.823 |
0.081 |
0.058 |
24 |
848.484 |
5251 |
|
Finland (246) |
Yes |
0.66 |
0.886 |
0.829 |
0.079 |
0.058 |
24 |
844.623 |
5496 |
|
France (250) |
Yes |
0.64 |
0.91 |
0.865 |
0.075 |
0.058 |
24 |
734.364 |
5279 |
|
Germany (276) |
Yes |
0.67 |
0.905 |
0.858 |
0.075 |
0.052 |
24 |
677.473 |
4853 |
|
Greece (300) |
Yes |
0.67 |
0.899 |
0.848 |
0.08 |
0.061 |
24 |
779.538 |
4933 |
|
Hong Kong (344) |
No |
0.73 |
0.917 |
0.876 |
0.081 |
0.060 |
24 |
752.816 |
4677 |
|
Hungary (348) |
Yes |
0.71 |
0.910 |
0.865 |
0.084 |
0.060 |
24 |
881.835 |
5027 |
|
Iceland (352) |
Yes |
0.64 |
0.895 |
0.843 |
0.071 |
0.055 |
24 |
402.752 |
3095 |
|
Ireland (372) |
Yes |
0.62 |
0.879 |
0.818 |
0.084 |
0.059 |
24 |
901.061 |
5201 |
|
Italy (380) |
Yes |
0.65 |
0.891 |
0.836 |
0.081 |
0.057 |
24 |
1705.972 |
10644 |
|
Japan (392) |
Yes |
0.63 |
0.885 |
0.827 |
0.08 |
0.052 |
24 |
902.483 |
5778 |
|
Korea (410) |
Yes |
0.73 |
0.913 |
0.87 |
0.081 |
0.06 |
24 |
858.347 |
5313 |
|
Latvia (428) |
Yes |
0.66 |
0.907 |
0.861 |
0.075 |
0.055 |
24 |
610.259 |
4390 |
|
Lithuania (440) |
No |
0.7 |
0.88 |
0.819 |
0.092 |
0.064 |
24 |
1133.432 |
5494 |
|
Luxemburg (442) |
Yes |
0.69 |
0.914 |
0.871 |
0.080 |
0.064 |
24 |
721.717 |
4546 |
|
Macao (446) |
No |
0.67 |
0.88 |
0.82 |
0.083 |
0.064 |
24 |
737.167 |
4268 |
|
Mexico (484) |
Yes |
0.71 |
0.888 |
0.831 |
0.103 |
0.051 |
24 |
1800.803 |
6977 |
|
Montenegro (499) |
No |
0.67 |
0.892 |
0.837 |
0.082 |
0.053 |
24 |
729.035 |
4379 |
|
Netherlands (528) |
Yes |
0.59 |
0.915 |
0.873 |
0.064 |
0.048 |
24 |
504.057 |
4913 |
|
New Zealand (554) |
Yes |
0.65 |
0.826 |
0.739 |
0.094 |
0.069 |
24 |
824.449 |
3773 |
|
Norway (578) |
Yes |
0.63 |
0.875 |
0.813 |
0.079 |
0.059 |
24 |
751.533 |
4886 |
|
Peru (604) |
No |
0.73 |
0.895 |
0.842 |
0.098 |
0.045 |
24 |
1528.132 |
6491 |
|
Poland (616) |
Yes |
0.64 |
0.86 |
0.789 |
0.091 |
0.067 |
24 |
859.031 |
4166 |
|
Qatar (634) |
No |
0.62 |
0.874 |
0.811 |
0.078 |
0.053 |
24 |
1393.175 |
9368 |
|
Russian Federat. (643) |
No |
0.67 |
0.911 |
0.866 |
0.072 |
0.052 |
24 |
668.919 |
5183 |
|
Singapore (702) |
No |
0.71 |
0.883 |
0.825 |
0.093 |
0.074 |
24 |
1217.337 |
5728 |
|
Slovak Republic (703) |
Yes |
0.71 |
0.893 |
0.84 |
0.08 |
0.055 |
24 |
845.719 |
5380 |
|
Slovenia (705) |
Yes |
0.67 |
0.907 |
0.86 |
0.076 |
0.055 |
24 |
833.518 |
5781 |
|
Spain (724) |
Yes |
0.69 |
0.907 |
0.86 |
0.079 |
0.057 |
24 |
945.932 |
6084 |
|
Sweden (752) |
Yes |
0.65 |
0.89 |
0.836 |
0.078 |
0.059 |
24 |
717.383 |
4706 |
|
Switzerland (756) |
Yes |
0.61 |
0.894 |
0.84 |
0.077 |
0.058 |
24 |
787.448 |
5319 |
|
United Arab Emirates (784) |
No |
0.6 |
0.847 |
0.77 |
0.083 |
0.058 |
24 |
1967.732 |
11679 |
|
Tunisia (788) |
No |
0.67 |
0.89 |
0.835 |
0.098 |
0.065 |
24 |
948.659 |
3988 |
|
Turkey (792) |
Yes |
0.73 |
0.88 |
0.819 |
0.105 |
0.065 |
24 |
1327.982 |
4959 |
|
United Kingdom (826) |
Yes |
0.66 |
0.877 |
0.816 |
0.085 |
0.061 |
24 |
1968.007 |
11157 |
|
United States (840) |
Yes |
0.72 |
0.863 |
0.795 |
0.102 |
0.068 |
24 |
1297.074 |
5060 |
|
Uruguay (858) |
No |
0.69 |
0.894 |
0.841 |
0.095 |
0.064 |
24 |
1066.445 |
4863 |
|
BSJG China (970) |
No |
0.77 |
0.913 |
0.87 |
0.094 |
0.057 |
24 |
1877.519 |
8760 |
|
Spain(regions) (971) |
Yes |
0.68 |
0.907 |
0.861 |
0.080 |
0.058 |
24 |
4554.095 |
29836 |
|
Portugal (620) |
Yes |
0.73 |
0.906 |
0.859 |
0.089 |
0.064 |
24 |
1326.639 |
6785 |
It is important
to point out that a well-fitted CFA model is essential before examining
measurement invariance. Although not all education systems showed a good fit,
invariance analyses were carried out because most of the education systems did.
Table 5 shows the baseline, configural, metric and scalar invariance models and
their respective fit measures considering the 54 education systems. As can be
observed, the baseline model showed fit indices slightly within acceptable
levels. When moving from the baseline model to the configural model, the fit
indices did not show much visible variation. Moving from the configural model
to the metric model, the variation in fit indices was a minor. The change in
RMSEA was of an acceptable level, while the change in CFI was not within the
expected value. Moving to the scalar invariance model, fit indices worsened
notoriously and changes in CFI and RMSEA were not acceptable. These results
clearly indicate that neither metric nor scalar levels of invariance were
reached, and thus it is not possible to compare latent variances, covariances
and means across all participating countries.
Table 5. Measurement invariance results for all
countries.
|
Level of invariance |
Chi-Square |
df |
CFI |
TLI |
RMSEA |
SRMR |
ΔCFI |
ΔRMSEA |
|
Baseline |
77538.35 |
24 |
0.893 |
0.840 |
0.094 |
0.059 |
||
|
Configural |
64501.252 |
1296 |
0.892 |
0.839 |
0.084 |
0.058 |
||
|
Metric |
94423.134 |
1614 |
0.842 |
0.810 |
0.092 |
0.076 |
-0.05 |
0.007 |
|
Scalar |
276736.061 |
1932 |
0.532 |
0.53 |
0.144 |
0.118 |
-0.31 |
0.052 |
In the
following stage, countries were grouped into three regions, namely, Latin
America, Asia and Europe. Next, a MG-CFA was carried out within each group in
order to explore whether measurement equivalence was supported.
Table 6
shows results for Latin American countries. The baseline model showed
satisfactory fit indices. Moving to the configural model, there was a slight
improvement in terms of fit indices. When moving from the configural to the
metric level, it can be seen that the CFI value decreased from 0.89 to 0.86 and
the RMSEA value increased from 0.92 to 0.95. These differences are just over
those proposed by Rutkowski and Svetina (2014). Moving to the scalar model the
CFI changed from 0.86 to 0.78 and RMSEA from 0.096 to 0.111. These results
demonstrate that factor loadings and intercepts are not equivalent across Latin
American countries, and thus no comparisons between latent variances,
covariances and means can be made.
Table 6. Measurement invariance results for Latin
American countries
|
Level of invariance |
Chi-Square |
df |
CFI |
TLI |
RMSEA |
SRMR |
ΔCFI |
ΔRMSEA |
|
Baseline |
12617.355 |
24 |
0.894 |
0.840 |
0.093 |
0.047 |
||
|
Configural |
12492.02947 |
192 |
0.899 |
0.850 |
0.092 |
0.049 |
||
|
Metric |
16450.02153 |
234 |
0.868 |
0.837 |
0.096 |
0.065 |
-0.032 |
0.004 |
|
Scalar |
26032.8548 |
276 |
0.790 |
0.781 |
0.111 |
0.077 |
-0.078 |
0.015 |
In Asian
countries (see Table 7) the baseline model fit indices were CFI = 0.88, TLI =
0.82 and RMSEA = 0.096. Moving from the baseline model to the configural model,
there was an increase in fit indices from 0.88 to 0.89 for CFI, from 0.82 to
0.84 for TLI and from 0.096 to 0.084 for RMSEA. When moving from the configural
to the metric model, the changes in CFI and in RMSEA were within acceptable
levels. Using Rutkowski and Svetina (2014)’s criteria, results indicate that
factor loadings are equivalent across Asian countries. CFI reduced from 0.87 to
0.66 and RMSEA increased from 0.083 to 0.124 when moving from the metric
invariance model to the scalar invariance model, which is higher than the
expected values. Again, these results indicate that intercepts are not
equivalent across Asian countries, and thus no comparison between latent means
can be made.
Table 7. Measurement invariance results for Asian
countries
|
Level of invariance |
Chi-Square |
df |
CFI |
TLI |
RMSEA |
SRMR |
ΔCFI |
ΔRMSEA |
|
Baseline |
14052.11418 |
24 |
0.885 |
0.828 |
0.096 |
0.061 |
||
|
Configural |
10900.12349 |
216 |
0.894 |
0.841 |
0.084 |
0.059 |
||
|
Metric |
12992.2109 |
264 |
0.873 |
0.845 |
0.0834 |
0.067 |
-0.020 |
-0.001 |
|
Scalar |
33652.24698 |
312 |
0.669 |
0.656 |
0.124 |
0.099 |
-0.204 |
0.041 |
In European
countries (see Table 8), the baseline model’s fit indices were acceptable (CFI
= 0.90, TLI = 0.86 and RMSEA = 0.080). Moving from the baseline model to the
configural model, fit indices marginally worsened (CFI from 0.90 to 0.89 and
TLI from 0.86 to 0.84). Similarly, when moving from the configural model to
metric model, no considerable change in fit indices was observed. CFI reduced
from 0.89 to 0.87 and RMSEA remained unchanged. These values are below those
proposed by Rutkowski and Svetina (2014), which suggests that factor loadings
are equivalent across countries. There was an extreme deterioration of model
fit indices when switching from the metric model to the scalar model as changes
in CFI and RMSEA were not of an acceptable level.
Table 8. Measurement invariance results for European
countries
|
Level of invariance |
Chi-Square |
df |
CFI |
TLI |
RMSEA |
SRMR |
ΔCFI |
ΔRMSEA |
|
Baseline |
31526.0374 |
24 |
0.907 |
0.861 |
0.080 |
0.056 |
||
|
Configural |
31886.0435 |
768 |
0.897 |
0.845 |
0.079 |
0.057 |
||
|
Metric |
38967.8366 |
954 |
0.874 |
0.848 |
0.079 |
0.065 |
-0.022 |
-0.0006 |
|
Scalar |
110087.353 |
1140 |
0.64 |
0.636 |
0.122 |
0.1 |
-0.234 |
0.043 |
5. Discussion
Identifying
the differences in student academic achievement across countries is one of the
main challenges facing education designers and practitioners who especially
dedicate themselves to eliminate disparities among students across the world.
Although the scale that measures the socio-economic background explains this
difference to a great extent, the adequacy of this scale in explaining this
difference remains to be discussed as there is a wide variety of groups in
PISA. There occur still two main criticisms to studies based on secondary
analyses of PISA in education, which are this scale’s lack of theoretical
background to formulate the hypotheses that they test, and the alleged lack of
comparability of this construct. Therefore, theoretically supporting the underlying
mechanisms of SES and making valid comparisons of this measure across countries
are essential requirements.
The primary
purpose of this paper was to address these criticisms by using items included
in the PISA 2015 student background questionnaire to create a SES scale based
on Bourdieu’s reproduction theory (i.e. latent variables measuring students’
economic, cultural and social capital) and to test the measurement invariance
of these constructs across PISA participating countries. In other words, this
study aimed to develop a reasonable theory-based structure from PISA existing
indicators and to examine the comparability of this theory-supported structure
across countries.
Regarding
the first criticism, we have formalized a model that consists of economic,
cultural and social capitals considering cultural reproduction theory of Pierre
Bourdieu. On the one hand, economic and cultural capital measures were selected
based on this theory and a wide range of related previous studies. WEALTH,
PARED, and HISEI indicators for economic capital and CULTPOSS, HEDRES and
number of books for cultural capital showed higher factor loadings, which is
similar to Caro et al. (2014)’s findings. On the other hand, COOPERATE,
CPSVALUE and EMOSUPS indicators showed acceptable factor loadings for social
capital. This factor, however, is a multidimensional concept that cannot be
easily measured using the available data.
Our results
showed that a construct derived from PISA’s indicators did not support
cross-cultural comparability across all countries, but just at the configural
level. However, after countries were split into more homogeneous groups (Latin
America, Asia, Europe), cross-cultural partial comparability was supported.
Rutkowski and Rutkowski (2018) have pointed out that ILSAs include
linguistically, geographically, economically, and culturally diverse
participating countries. Therefore, they suggest that well-structured
country-specific indicators should be produced rather than single indicators
for all participating countries. This way, it would be possible for each
participating country to incorporate their territorial conditions into comparable
international scales (Rutkowski and Rutkowski, 2018; Sandoval-Hernandez et al.,
2019).
The results
of this study provide solutions and recommendations that should be considered
and implemented. The analyses including all countries, do not support comparisons
across education systems when using this socio-economic status scale, as
neither the metric level of invariance nor the scalar level were reached. This
may be partly related to regional and socio-cultural factors, as well as
language as stated by Lee (2019) in her work focusing on the home possessions
scale. Although the Latin American group did not achieve the metric invariance
level, results were close to acceptable values. In both Asian and European
countries, the metric level was achieved but not at scalar invariance level.
Sandoval-Hernandez et al. (2019) have highlighted that in TERCE - a much more
regional assessment – the socio-economic background scale reached the metric
level of invariance. Our suggestion goes in line with what Rutkowski and
Rutkowski (2018) state, in that ILSAs would benefit from the “the active
involvement of countries or regions to develop and include more country or
regional options into the background questionnaire” (p.365).
6.
Limitations
This study
has limitations that should not be ignored. Firstly, it is worth mentioning
that the variable ‘number of books’ is categorical. In order to carry out the
analysis in a way that takes into account the survey design, variables must be
continuous. However, Liu et al. (2017) state that if there are more than five
response categories in ordered-categorical data, it may be acceptable to
analyse them as continuous data. Since this variable has more than five
response categories, it is reasonable to assume that there was no significant
bias in parameter estimation.
Another
limitation is that social capital is an indicator of socio-economic background,
however, there are not enough items that capture and measure social capital in
PISA. Therefore, this study encourages policymakers and educational research
designers to consider this and act towards this direction. Moreover, social
capital is an extensive and multidimensional notion that comprises different
dimensions such as structural, cognitive and relational factors. We have mostly
conceptualised social capital using variables relating to interpersonal
relationships and parental responsibility in education. Since indicators of
social capital are limited, we could not focus on all aspects of this
construct.
It is worth
noting that this study was carried out to determine whether a SES scale was
invariant and did not focus on the reasons triggering invariance. In this
context, if measurement invariance is detected in a given step, successive
analyses should be carried out to determine the reasons for this invariance
before proceeding to the next stage.
7.
Conclusion
This paper
has supplied evidence that PISA indicators of socio-economic background have
serious psychometric deficiencies when used to elucidate differences in
educational achievement across different educational systems. Further
investigation on the comparability of other scales included in PISA’s
background questionnaires, such as teaching practices, could be carried out
given the diversity of participating countries. Such studies are necessary
because PISA’s report provides information on such scales, and many researchers
around the world use these variables to explain academic achievement. Making an
evidence-based comparison among countries is undoubtedly a need for educators
in each country.
As revealed
in this study, when dividing countries into groups according to
region/continent, comparability across education systems of some background
scales could be supported by evidence. In that sense, two alternatives can be
considered. On the one hand, ILSAs could use continent-specific or
country-specific items for its background questionnaires. On the other hand,
the process of developing background questionnaires could be benefitted from
more heterogeneous groups of experts that represent different countries and
languages. By adopting these suggestions, the necessity of designing
assessments with a focus on specific regions will have been addressed.
References
Abel, T. (2008). Cultural capital and social
inequality in health. Journal of Epidemiology & Community Health, 62(7),
e13-e13.
Addey, C. & Sellar, S. (2018). Why Do
Countries Participate in PISA? Understanding the Role of International
Large-Scale Assessments in Global Education Policy. En Verger, A., Altinyelken,
H.K. and Novelli, M. (Eds.), Global education policy and international
development: New agendas, issues and policies (pp. 98-117). Bloomsbury
Publishing.
Addey, C., Sellar, S., Steiner-Khamsi, G.,
Lingard, B., & Verger,A. (2017). The rise of International large-scale
assessments and rationales for participation. Compare: Ajournal of Comparative
and International Education, 47(3), 434-452.
Alivernini, F. (2011). Measurement invariance
of a reading literacy scale in the Italian Context: a psychometric
analysis. Procedia-Social and Behavioral Sciences, 15, 436-441.
Aloisi, C., & Tymms, P. (2017). PISA
trends, social changes, and education reforms. Educational Research and
Evaluation, 23(5-6), 180-220.
Barone, C. (2006). Cultural capital, ambition
and the explanation of inequalities in learning outcomes: A comparative
analysis. Sociology, 40(6), 1039-1058.
Bialosiewicz, S., Murphy, K. & Berry, T.
(2013). An introduction to measurement invariance testing: Resource packet for
participants. Retrieved from https://bit.ly/3iQoCI5
Bodovski, K., Jeon, H., & Byun, S. Y.
(2017). Cultural capital and academic achievement in post-socialist Eastern
Europe. British Journal of sociology of Education, 38(6), 887-907.
Bourdieu, P. (1986). The forms of capital. In
J. Richardson (Ed.), Handbook of theory and research for the sociology of
education. New York: Greenwood.
Bourdieu, P. (1997). The Forms of Capital. In
Education: Culture, Economy, and Society, edited by A. H. Halsey, H. Lauder, P.
Brown, and A. Stuart Wells, 47-58. Oxford: Oxford University Press.
Bornstein, M. C., & Bradley, R. H. (Eds.).
(2003). Socioeconomic status, parenting, and child development. Mahwah, NJ:
Lawrence Erlbaum.
Bradley, R. H., & Corwyn, R. F. (2002).
Socioeconomic status and child development. Annual Review of Psychology, 53,
371-399.
Brown, T. A. (2015). Confirmatory Factor
Analysis for Applied Research. New York: Guildford Press.
Byrne, B. M., & Stewart, S. M. (2006).
Teacher’s corner: The MACS approach to testing for multigroup invariance of a
second-order structure: A walk through the process. Structural equation
modeling, 13(2), 287-321.
Byrne, B. M., & Van de Vijver, F. J. R.
(2010). Testing for measurement and structural equivalence in large-scale
cross-cultural studies: Addressing the issue of nonequivalence. International
Journal of Testing, 10, 107-132.
Caro, D. H., & Cortés, D. (2012). Measuring
family socioeconomic status: An illustration using data from PIRLS
2006. IERI Monograph Series Issues and Methodologies in Large-Scale
Assessments, 5, 9-33.
Caro, D. H.,
Sandoval-Hernandez, A., & Lüdtke, O. (2014). Cultural, social, and economic capital
constructs in international assessments: An evaluation using exploratory
structural equation modelling. School Effectiveness and School Improvement,
25(3), 433-450.
Cheung, G. W., & Rensvold, R. B. (2002).
Evaluating goodness-of-fit indexes for testing measurement invariance.
Structural equation modelling, 9(2), 233-255.
Coe, R., & Fitz-Gibbon, C. T. (1998). School Effectiveness Research:
Criticisms and Recommendations. Oxford Review of Education, 24(4), 421–438.
Coleman, J. S., Campbell, E. Q., Hobson, C. J.,
McPartland, J., Mood, A. M., Weinfeld, F. D., & York, R. L. (1966).
Equality of Educational Opportunity. Washington, DC: US Government Printing
Office.
Coleman, J. S. (1988). Social capital in the
creation of human capital. The American Journal of Sociology, 94(1) Supplement.
Organizations and institutions: Sociological and economic approaches to the
analysis of social structure, pp. 95-120.
Cronbach, L. J. (1951). Coefficient alpha and
the internal structure of tests. Psychometrika, 16(3), 297-334.
Demir, E. (2017). Testing Measurement Invariance
of the Students’ Affective Characteristics Model across Gender
Sub-Groups. Educational Sciences: Theory and Practice, 17(1), 47-62.
DiMaggio, P. (1982). Cultural Capital and
School Success: The Impact of Status Culture Participation on the Grades of
U.S. High School Students. American Sociological Review, 47 (2), 189-201.
Garcia Aracil, A. D. E. L. A., Neira, I., &
Albert, C. (2016). Social and Cultural Capital Predictors of Adolescents’
Financial Literacy: Family and School Influences. Revista de Educación,
(374), 91-115.
Gordon W. C. & Roger B., R. (2002).
Evaluating Goodness-of-Fit Indexes for Testing Measurement Invariance,
Structural Equation Modeling, 9(2), 233-255.
Goldstein, H. (2017). Measurement and
evaluation issues with PISA. En Louis Volante (Eds.), In The PISA effect on
global educational governance. New York and London, Routledge.
Gregorich, S. E. (2006). Do self-report
instruments allow meaningful comparisons across diverse population groups?
Testing measurement invariance using the confirmatory factor analysis
framework. Medical Care, 44, 78-94.
Hair, J.F., Black, W.C., Babin, B.J., &
Anderson, R.E. (2010). Multivariate Data Analysis. Seventh Edition. New Jersey:
Prentice Hall, Upper Saddle River.
Hansson, Å., & Gustafsson, J. E. (2013).
Measurement invariance of socioeconomic status across migrational
background. Scandinavian Journal of Educational Research, 57(2),
148-166.
He. J., Barrera-Pedemonte, F., & Buchholz,
J. (2018). Cross-cultural comparability of noncognitive construction in TIMSS
and PISA. Assessment in Education: Principles, Policy & Practice, 1-17.
Hobbs, G., & Vignoles, A. (2007). Is
free school meal status a valid proxy for socio-economic status (in schools
research)? (No. ٨٤).
Centre for the Economics of Education, London School of Economics and Political
Science.
Hopfenbeck, T. N., Lenkeit, J., El Masri, Y.,
Cantrell, K., Ryan, J., & Baird, J. A. (2018). Lessons learned from PISA: A
systematic review of peer-reviewed articles on the programme for international
student assessment. Scandinavian Journal of Educational
Research, 62(3), 333-353.
Hu, L. T., & Bentler, P. M. (1999). Cutoff
criteria for fit indexes in covariance structure analysis: Conventional
criteria versus new alternatives. Structural equation modeling: a
multidisciplinary journal, 6(1), 1-55.
Kalaycioglu, D. B. (2015). The Influence of
Socioeconomic Status, Self-Efficacy, and Anxiety on Mathematics Achievement in
England, Greece, Hong Kong, the Netherlands, Turkey, and the USA. Educational
Sciences: Theory and Practice, 15(5), 1391-1401.
Klieme, E. (2016). TIMSS 2015 and PISA 2015.
How are they related on the country level. German Institute for
International Educational Research (DIPF). Retrieved from http://www. dipf.
de/de/publikationen/pdf-publikationen/Klieme_TIMSS2015andPISA2015. pdf.
Kline, R.B., (2011). Principles and Practices
of Structural Equation Modelling. 3rd ed. New York: The Guilford Press.
Lareau (2011). Unequal childhoods: Class, race,
and family life (2nd ed.). Berkeley, CA: University of California Press.
Lauder, H., Jamieson, I., & Wikeley, F.
(1998). Models of Effective Schools: Limits and Capabilities. In R. Slee, G.
Weiner, & S. Tomlinson (Eds.), School Effectiveness for whom?: Challenges
to the School Effectiveness and School Improvement Movements. London: Falmer
Press.
Lee, S. S. (2019). Longitudinal and
Cross-Country Measurement Invariance of The Pisa Home Possessions Scale. Publicly Accessible Penn Dissertations. 3310. https://repository.upenn.edu/edissertations/3310
Lenkeit, J., Caro, D. H., & Strand, S.
(2015). Tackling the remaining attainment gap between students with and without
immigrant background: An investigation into the equivalence of SES
constructs. Educational Research and Evaluation, 21(1), 60-83.
Lietz, P., Cresswell, J. C., Rust, K. F., &
Adams, R. J. (2017). Implementation of Large-Scale Education Assessments. En Petra
Lietz, John C. Cresswell, Keith F. Rust and Raymond J. Adams (Eds.)
Implementation of Large-Scale Education Assessments. John Wiley & Sons.
Liu, Y., Millsap, R. E., West, S. G., Tein, J.
Y., Tanaka, R., & Grimm, K. J. (2017). Testing measurement invariance in
longitudinal data with ordered-categorical measures. Psychological
methods, 22(3), 486.
Marteleto, L., & Andrade, F. (2014). The
educational achievement of Brazilian adolescents: Cultural capital and the
interaction between families and schools. Sociology of
Education, 87(1), 16-35.
Meredith, W. (1993). Measurement invariance,
factor analysis and factorial invariance. Psychometrika, 58(4),
525-543.
Milfont, T.L., & Fischer, R. (2015).
Testing measurement invariance across groups: Applications in cross-cultural
research. International Journal of Psychological Research, 3, 111-130.
Millsap, R. E. & Olivera-Aguilar, M.
(2012). Investigating measurement invariance using confirmatory factor
analysis. In R. H. Hoyle (Ed.), Handbook of structural equation modelling (pp.
380-392). New York, NY: Guilford Press.
Miranda, D. and Castillo, J. C. (2018).
Measurement model and invariance testing of scales measuring egalitarian values
in ICCS 2009. En A. Sandoval-Hernandez, M. M. Isac and D. Miranda (Eds.)
Teaching Tolerance in a
Globalized World. Cham: Springer International Publishing
Mullis, I. V. (2002). Background questions in
TIMMS and PIRLS: An overview. Paper commissioned by the National Assessment
Governing Board, http://www.nagb.org/release/Mullis.doc.
Neff, W. S. (1938). Socioeconomic status and
intelligence: A critical survey. Psychological Bulletin, 35(10), 727.
Oberski, D. (2014). lavaan. survey: An R
package for complex survey analysis of structural equation models. Journal
of Statistical Software, 57(1), 1-27.
OECD (2017). PISA 2015 Technical Report. Paris,
France: OECD Publishing.
OECD (2018). PISA 2015 Results in Focus.
Available at: https://www.oecd.org/pisa/pisa-2015-results-in-focus.pdf Accessed 9 December 2019.
Oliveri, M. E., & Ercikan, K. (2011). Do different approaches to examining
construct comparability in multilanguage assessments lead to similar
conclusions?. Applied Measurement in Education, 24(4), 349-366.
Park, H., & Sandefur, G. D. (2006).
Families, schools, and reading in Asia and Latin America. In Children’s Lives
and Schooling across Societies (pp. 133-162). Emerald Group Publishing Limited.
Pitzalis, M., & Porcu, M. (2017). Cultural
capital and educational strategies. Shaping boundaries between groups of
students with homologous cultural behaviours. British Journal of Sociology
of Education, 38(7), 956-974.
Pokropek, A., Borgonovi, F., & Jakubowski,
M. (2015). Socio-economic disparities in academic achievement: A comparative
analysis of mechanisms and pathways. Learning and Individual Differences, 42,
10-18.
Pokropek, A., Borgonovi, F., & McCormick, C.
(2017). On the
Cross-Country Comparability of Indicators of Socioeconomic Resources in PISA.
Applied Measurement in Education, 30(4), 243-258.
Puzic, S., Gregurović, M., & Košutić, I.
(2016). Cultural capital–a shift in perspective: An analysis of PISA 2009 data
for Croatia. British journal of sociology of education, 37(7),
1056-1076.
Puzic, S., Gregurović, M., & Košutić, I.
(2018). Cultural Capital and Educational Inequality in Croatia, Germany and
Denmark: A Comparative Analysis of the PISA 2009 Data. Revija za socijalnu
politiku, 25(2), 133-156.
R Core Team (2019). R: A language and
environment for statistical computing. R Foundation for Statistical Computing,
Vienna, Austria. Retrieved from https://www.R-project.org/.
Rogošić, S., & Baranović, B. (2016). Social
capital and educational achievements: Coleman vs. Bourdieu. Center for
Educational Policy Studies Journal, 6(2), 81-100.
Rosseel, Y. (2012). Lavaan: An R package for
structural equation modeling and more. Version 0.5–12 (BETA). Journal of
statistical software 48(2), 1-36.
Rutkowski, L., & Rutkowski, D. (2010).
Getting it ‘better’: the importance of improving background questionnaires in
international large-scale assessment. Journal of Curriculum Studies, 42(3),
411-430.
Rutkowski, D., & Rutkowski, L. (2013). Measuring
socioeconomic background in PISA: One size might not fit all. Research in
Comparative and International Education, 8(3), 259-278.
Rutkowski, L., & Svetina, D. (2014).
Assessing the hypothesis of measurement invariance in the context of
large-scale international surveys. Educational and Psychological
Measurement, 74(1), 31-57.
Rutkowski, L., & Rutkowski, D. (2018).
Improving the comparability and local usefulness of international assessments:
A look back and a way forward. Scandinavian Journal of Educational
Research, 62(3), 354-367.
Sandoval-Hernandez, A., Rutkowski, D., Matta,
T., & Mirnda, D. (2019). Back to the drawing board: Can we compare
socioeconomic background scales?. REVISTA DE EDUCACION, (383), 37-61.
Segeritz, M., & Pant, H. A. (2013). Do they
feel the same way about math? Testing measurement invariance of the PISA
“students’ approaches to learning” instrument across immigrant groups within
Germany. Educational and Psychological Measurement, 73(4), 601-630.
Sirin, S. R. (2005). Socioeconomic status and
academic achievement: A meta-analytic review of research. Review of educational
research, 75(3), 417-453.
Steiner-Khamsi, G. (2019). Conclusions: What
Policy-Makers Do with PISA. En Florian Waldow and Gita Steiner-Khamsi (Eds.)
Understanding PISA’s Attractiveness Critical Analyses in Comperative Policy
Studies. Bloomsbury Publishing.
Tan, C. Y. (2015). The contribution of cultural
capital to students’ mathematics achievement in medium and high socioeconomic
gradient economies. British Educational Research Journal, 41(6),
1050-1067.
Thein, L. M., & Ong, M. Y. (2015).
Malaysian and Singaporean students’ affective characteristics and mathematics
performance: evidence from PISA 2012. SpringerPlus, 4(1), 563.
Tijana, P. B., & Anna, S. (2015). PISA The
Experience of Middle-Income Countries Participating in PISA 200-2015. OECD
Publishing.
Torney-Purta, J., & Amadeo, J. A. (2013).
International large-scale assessments: Challenges in reporting and potentials
for secondary analysis. Research in Comparative and International Education,
8(3), 248-258.
UN (2015). Transforming Our World: The 2030
Agenda for Sustainable Development, 2nd August 2015. New York: United Nations.
Uysal, N. K., & Arıkan, Ç. A. (2018).
Measurement Invariance of Science Self-Efficacy Scale in PISA. International
Journal of Assessment Tools in Education, 5(2), 325-338.
Vanderberg, R. J., & Lance, C. E. (2000). A
Review and Synthesis of the Measurement Invariance Literature: Suggestions
Practices, and Recommendations for Organizational Research. Organizational
Research Methods, 3(1), 4-70.
Van de Vijver, F. J. R., & Leung, K.
(1997). Methods and data analysis for cross-cultural research. Thousand Oaks,
CA: Sage.
Van de Vijver, F. J. R., & Poortinga, Y. H.
(2002). Structural equivalence in multilevel research. Journal of
Cross-Cultural Psychology, 33, 141-156.
Van de Vijver, F. J. (2018). Towards an
Integrated Framework of Bias in Noncognitive Assessment in International
Large-Scale Studies: Challenges and Prospects. Educational Measurement: Issues
and Practice, 37(4), 49-56.
White, K. R. (1982). The relationship between
socioeconomic status and academic achievement. Psychological Bulletin, 91,
461-481.
Widaman, K. F., Reise, S. P., Bryant, K. J.,
& Windle, M. (1997). Exploring the measurement invariance of psychological
instruments: Applications in substance use domain. Ariel, 165, 220-14.
Wu, A. D., Li, Z., & Zumbo, B. D. (2007).
Decoding the meaning of factorial invariance and updating the practice of
multi-group confirmatory factor analysis: A demonstration with TIMSS
data. Practical Assessment, Research & Evaluation, 12(3), 1-26.
Wu, M. (2010). Comparing the Similarities and
Differences of PISA 2003 and TIMSS. OECD Education Working Papers, 32, Paris:
OECD Publishing. https://doi.org/10.1787/5km4psnm13nx-en
Yang, Y. (2003). Dimensions of socio-economic
status and their relationship to mathematics and science achievement at
individual and collective levels. Scandinavian Journal of Educational Research,
47(1), 21-41.
How to Cite
Erylmaz,
N., Rivera-Gutiérrez, M., & Sandoval-Hernández, A. (2020). Should different
countries participating in PISA interpret socioeconomic background in the same
way? A measurement invariance approach. Iberoamerican Journal of
Education, 84(1), 109-133. https://doi.org/10.35362/rie8413981