Computing in Basic Education: Enhancing the learning of Geography for students with visual disabilities
Elias Dos Santos Silva Junior 1 
Sérgio Crespo Coelho da Silva Pinto 1 
1 Universidade Federal Fluminense (UFF), Brasil
Abstract. Brazilian society does not guarantee people with disabilities the educational resources that allow for inclusive and egalitarian education for all. We prove the effectiveness and efficiency in the use of computational resources added to the designer’s concepts for the development of an innovative and inclusive product. The research was conducted at the Benjamin Constant Institute. The methodology used was evolutionary computing prototyping and the interview technique for the validation of the Map. In the evaluation, we used the interview technique, questionnaires, in addition to non-participant systematic observation. Three geography teachers and ten visually impaired students who studied the proposed content participated. Teachers approved the technology in its characteristics and functionality, respectively, by 90.06% and 97%. Students rated the map features 94.54% and the features a 99.25% approval rating. The research promoted the quality of teaching to students with visual impairments when it allowed them to manage a volume of information about the Southeast Region of Brazil and increased their autonomy in allowing them to repeat any information they had not assimilated, without the need for help.
Keywords: inclusion; prototyping; tactile maps; teaching; teaching materials.
Computación en la educación básica: mejora del aprendizaje de la geografía para estudiantes con discapacidades visuales
Resumen. La sociedad brasileña no garantiza a las personas con discapacidad los recursos educativos que permitan una educación inclusiva e igualitaria para todos. Demostramos la efectividad y eficiencia en el uso de recursos computacionales sumados a los conceptos del diseñador para el desarrollo de un producto innovador e inclusivo. La investigación se llevó a cabo en el Instituto Benjamin Constant. La metodología utilizada fue el prototipado informático evolutivo y la técnica de entrevista para la validación del Mapa. En la evaluación se utilizó la técnica de entrevista, cuestionarios, además de la observación sistemática no participante. Participaron tres profesores de geografía y diez estudiantes con discapacidad visual que estudiaron el contenido propuesto. Los docentes aprobaron la tecnología en sus características y funcionalidad, respectivamente, en un 90,06% y 97%. Los estudiantes calificaron las características del mapa con un 94,54% y las características con una calificación de aprobación del 99,25%. La investigación promovió la calidad de la enseñanza a los estudiantes con discapacidad visual cuando les permitió manejar un volumen de información sobre la Región Sudeste de Brasil y aumentó su autonomía al permitirles repetir cualquier información que no habían asimilado, sin necesidad de ayuda.
Palabras clave: inclusión; prototipos; mapas táctiles; enseñando; materiales de enseñanza.
Computação na educação básica: aprimorando o aprendizado de geografia para alunos com deficiência visual
Resumo. A sociedade brasileira não garante às pessoas com deficiência os recursos educacionais que permitam uma educação inclusiva e igualitária para todos. Comprovamos a eficácia e a eficiência na utilização de recursos computacionais somados aos conceitos de designer para o desenvolvimento de um produto inovador e inclusivo. A pesquisa foi realizada no Instituto Benjamin Constant. A metodologia empregada foi a prototipagem de computação evolutiva e a técnica da entrevista para a validação do Mapa. Na avaliação, utilizamos a técnica de entrevista, os questionários, além da observação sistematizada não-participante. Participaram três professores de Geografia e dez discentes com deficiência visual que estudaram o conteúdo proposto. Os professores aprovaram a tecnologia em suas características e funcionalidades, respectivamente, em 90,06% e 97%. Os alunos avaliaram as características do mapa em 94,54% e as funcionalidades com 99,25% de aprovação. A pesquisa promoveu a qualidade do ensino ao discente com deficiência visual quando lhe permitiu a gerência de um volume de informações sobre a Região Sudeste do Brasil e aumentou a autonomia em permitir repetir qualquer informação que ele não tenha assimilado, sem a necessidade de auxílio.
Palavras-chave: inclusão; prototipagem; mapas táteis; ensino; materiais didáticos.
1. Introduction
The legal provisions that were built through public policies aimed at people with disabilities from imperial Brazil to the present day, such as the Declaration of Salamanca, which grants people with disabilities the right to receive the same education without disagreement over their disabilities and thus, the basis for inclusive education in Brazil was defined (UN, 1994).
The Law of Guidelines and Bases (Brasil, 1996), Law No. 9394/96, guaranteed all students, without distinction, their entry into the regular school system, giving preference to common classes. As a solid basis, Law No. 13,146, Brazilian Law for the Inclusion of Persons with Disabilities (Brasil, 2015), which guarantees persons with disabilities, guaranteeing equal conditions, the right and fundamental freedoms, aiming to include it, definitively, as a citizen.
Brandão (2009), defines the vision as a means of communication, for understanding concepts, building representations, and understanding social transformations.
Vision allows us to appropriate news, events, observe events; visually impaired people, therefore, are private and limited in learning these phenomena of culture and content transfers.
Some characteristics about Visual Impairment (VI) are addressed by Figueiredo (2017) when he defines it by: “inability to see or see well, being able to limit or prevent direct access to various daily activities, such as: orientation and mobility independent, manual skills, concept acquisition and the written word” (Figueiredo, 2017, p. 35).
In this context, the law summarizes us in a more technical view, the differences of blindness and low vision, in relation to Decree No. 3,298, of December 20, 1999, regulates in its Art. 4, Item III, the categories of people with disabilities visual, when he says that to:
III - visual impairment - Blindness, in which visual acuity is equal to or less than 0.05 in the best eye, with the best optical correction; low vision, which means visual acuity between 0.3 and 0.05 in the best eye, with the best optical correction; cases in which the sum of the measurement of the visual field in both eyes is equal to or less than 60º; or the simultaneous occurrence of any of the previous conditions (Brasil, 1999, Art. 4º Item III).
There are other means of classification for visual impairment, as shown by Figueiredo (2014) when he says that, only after the middle of the 20th century, the visual potential of people with visual impairment was analyzed in view of their educational performance, valuing, and exploring the visual residues existing in these people, because before, they received the same type of educational assistance (Figueiredo, 2014).
Amiralian (1997) rescues this reasoning when he points out that: There are other means of classification for visual impairment, as shown by Figueiredo (2014) when he says that, only after the middle of the 20th century, the visual potential of people with visual impairment was analyzed in view of their educational performance, valuing and exploring the visual residues existing in these people, because before, they received the same type of educational assistance (Figueiredo, 2014).
Until the seventies, the classification of subjects as blind, and their indication for teaching by the Braille method, was based on the ophthalmological diagnosis. However, the realization that many “blind” children read Braille with their eyes has led specialists to reformulate the concept, which began to focus on the way in which the subject apprehends the external world. Thus, those for whom touch, smell and kinesthesia are the primary senses in the apprehension of the external world have come to be considered blind. And subjects with residual vision (low vision), those who, although impaired in their vision, use it satisfactorily in their learning process (Amiralian, 1997, p. 29).
The authors point out that the residual vision of the student will classify him, to such an extent that the teacher, when educating him, should know him and explore him in his residual visual potentials, regardless of his clinical diagnosis, for a greater academic achievement.
Public policies can manage the lives of citizens in an organized society. According to Mead (1995), he defines public policy as a study of politics that analyzes the government in the view of major public issues. Lynn (1980) emphasizes that actions provided by the government produce specific results. Peters (1986) says that Public Policies are the result of a set of actions by governments that directly impact the lives of citizens.
The concepts involving the rights of persons with disabilities could be separated into three phases: “the policy of segregation, the policy of integration and the policy of an inclusive society”. For Vivarta (2003, p.17), for centuries people with disabilities were labeled as worthless citizens, being placed in a context of total exclusion, she says.
The Brazilian legislative production has been quite numerous in terms of dealing with the rights reserved for people with disabilities, allowing them many legal advances, thus opening the way for Brazil to transform today’s society into an inclusive society.
Thus, this article aims to disseminate the creation of an Assistive Technology that allows students with visual impairments to have access to the knowledge of geographic maps through the computation used in these educational products.
2. Methodology
For Marconi and Lakatos (2011, p. 83) the scientific method is not exclusive to science, but “there are no sciences without the use of scientific methods”. Thus, for the author, method is a set of systematized and rational activities that, with greater security and economy, allows reaching the goal - valid and true knowledge, tracing the path to be followed, detecting errors, and assisting research decisions.”
The bibliographic survey approached a broader view on the various subjects, aiming to be able to provide relevant data on the theme presented by this research and related to the evolutionary process of the prototype built until its maturation as a product.
The selection criteria used in the works and in the academic databases (Google Scholar, SciELO and CAPES Journals) for the choice of the authors mentioned were intended for the reader to obtain a conceptual and characteristic understanding of the Public Policies aimed at people with disabilities, visual impairment, education for visually impaired people, the senses in the teaching and learning process, Assistive Technology including visually impaired people, Embedded Computing and the Internet of Things.
This research was developed through the understanding of the topics already structured in the bibliographic survey that allowed us to know, in more detail, the visual impairment and its characteristics, providing us with the necessary basis to better choose the keywords that we use in the search of the bases, they are tactile maps; blindness; low vision; congenital and acquired.
With the Strings previously established, they were researched on the following academic bases:
• Scientific Electronic Library Online, (http://www.scielo.org/php/index.php).
• Google academic (https://scholar.google.com.br/); and
• CAPES journals (http://www.periodicos.capes.gov.br/).
As exclusion criteria and in that order:
• We remove articles with titles that are not relevant to the search.
• We remove repeated articles.
• We removed articles that were not available in their full version; and
• We removed articles that, after a complete reading, did not present any contribution to the researched topic.
The questions we answer with research on academic grounds are:
• How to produce tactile maps that meet the specificities of people with congenital blind visual impairment?
• How to produce tactile maps that meet the specificities of people with acquired blind visual impairment?
• How to produce tactile maps that meet the specific needs of people with low vision?
• How to create safer tactile maps?
The survey resulted in articles, dedicated to the construction of tactile maps, choice of materials and good practices to guide us (What to do? What not to do? How to do?) In the construction of tactile maps that were intended to include people with congenital or acquired visual impairments about overcoming the barriers that are imposed by blindness and low vision. This information was relevant to the construction of Embedded Computing in Tactile Maps, the system was named in CEMT (acronym in Portuguese language Computação Embarcada em Mapas Táteis).
As a result of the bibliographic research, carried out on the academic bases mentioned above, we found articles that dealt with Assistive Technologies (AT) as: Cook and Hussey (1995, p. 5) define as “a wide range of equipment, services, strategies and practices designed and applied to address the functional problems encountered by individuals with disabilities ”, that is, the authors generalize these concepts by understanding that all resources that promote the well-being of people with disabilities are AT. Since July 2015, Brazil, through the Brazilian Inclusion Law (LBI), defines AT as:
[...] products, equipment, devices, resources, methodologies, strategies, practices, and services that aim to promote functionality, related to the activity and participation of people with disabilities or reduced mobility, aiming at their autonomy, independence, quality of life and social inclusion (Brasil, 2015, Art. 3º Item III).
According to Bersch (2017, p. 4), AT is classified into categories, and “assistive technology resources are organized or classified according to the functional objectives they are intended for”. According to the author, “several AT classifications were developed for different purposes”.
In general, the Assistive Technologies available on the market for people with visual impairments are: computers with software for screen reading using speech synthesizers (Jaws, Virtual Vision and Dosvox); voice feedback applications; scanner for scanning texts; conversion of written text to spoken text (DOC to .MP3, in Portuguese) using the Rob braille service; Mecdaisy that enables spoken digital books; collection of spoken or Braille books in various libraries; headphones for listening to spoken books and texts; Themorform; the soroban; recorders; Perkins Braille typewriter; Regletes; punctures; Braille writing; magnifying glasses and lenses, canes and Braille printers.
Technology is undoubtedly an ally in the inclusion process, especially about the development of Assistive Technologies, in the category of accessibility resources to computing. According to Bersch (2017, p. 4) “the Assistive Technology resources are organized or classified according to the functional objectives they are intended for”, in this journey, the research seeks to improve the functionality of the tactile maps for teaching the listening person with visual impairment becoming relevant, as it promotes the union of the senses of touch and hearing, contributing to the sensory development of students who can use it as a benefit in their teaching and learning process.
The field research met all ethical precepts, as we involved people as participants, we only started the field research after the favorable opinion of the UFF Research Ethics Committee (CEP, 2017), which was submitted to Platform Brazil under the number registration number 71088017.2.0000.5243.
As the first volunteer collaborator in this research, we had Professor Participant 01, professor of Geography at the Benjamin Constant Institute from the sixth to the ninth year, with the signed and agreed consent form. This professor accompanied the researcher throughout the research at IBC and who assisted in the subject of Geography on the characteristics of the Southeast Region of Brazil in his classes and in the production of the experiment.
3. The Evolutionary Prototyping of Embedded Computing in Tactile Maps (CEMT)
A prototype aims to anticipate all the functionality of a product desired by its users in the construction of the first version of the prototype and as users interact with this prototype, new requirements are discovered and incorporated into the next versions (Pressman, 2011). The prototyping process ends only when the prototype reaches maturity, that is, when all the needs of its users are met, transforming it into a product ready to be enjoyed by its consumers.
In the conceptualization of the Sommerville prototype (2011, p. 30) it understands to be “an initial version of a software system”, it is used for the presentation of a concept, where in the experimentation of the variations of the project, the problems, and your solutions.
The processes involved in the construction and development of the CEMT as an embedded computer prototype required a significant effort so that the design of its product was easy to use and could meet the needs and expectations of its users.
The first version of the experimental prototype of the CEMT Map was designed and developed using the concept of affordances, Normandi (2016, p.17), with the aim of creating a product design that is easy to use, intuitive and that could save as much as possible the evolutionary prototyping process that was applied in research with IBC (Benjamin Constant Institute) professors and students.
We seek to follow the standards of Silva (2017), Nogueira (2016) and Alexandrakis (2016) related to the size of the map, respecting the concept of tactile field, which is much smaller than the field of vision and the care with the size of tactile symbols and its provision on the CEMT Map.
We also observed the concept of body effort given by Degreas and Katakura (2016) that the tactile maps should not be so large to avoid a greater physical effort than is necessary for the consumer of this map.
Therefore, we seek to find a compromise between the full-size scale of the CEMT Map and a better proportion so that the smaller states could receive sensors, tactile textures, Braille, and ink writing in a less polluted, more pleasant, and accessible way to the student.
In the construction process, we used the concepts addressed by Nogueira (2016) and by Cenci and Bernardi (2016), in the question of the construction of textures, to be well differentiated, safe, pleasant. We applied the technique followed by Oliveira (2016) in the use of acrylic mass in the formation of the texture and tactile symbols very well sanded to eliminate any risk of accident to the user of the CEMT Map.
After the texturing process of the CEMT map, we started the procedures to embark the hardware on the wooden map to accommodate the printed circuit board, the battery, the power supply, the headphone jack, the Universal Serial input Bus - USB, the serial input and all forty-six sensors (figure 1).
When choosing colors, we follow the guidelines of Nogueira (2016), Lima and Fonseca (2016), Stampach and Mulickova (2016), on the use of strong and contrasting colors for painting the CEMT Map, in addition to referring to the NR26 Reference Standard about Safety Signs, that is why we chose the colors: orange, lilac, black, yellow, green, blue and red. Each texture was painted in a single color, as recommended by Silva (2017) to better serve people with low vision disabilities.
In the approach of Degreas and Katakura (2016), the authors used the Compass Rose, thus, as we used in our research to provide students with a reference of geographical location.
We use Braille as official writing on the map, according to the guidelines of Alves et al. (2016), Minhat et al. (2017), Alexandrakis (2016), and Giorgos (2017).
The choice of tactile symbols, their shape and size were providential to not leave the CEMT Map polluted with various tactile information, as well, as guided by the works of Bem (2016), Oliveira (2016), Alexandrakis (2016), Silva and Rocha (2016), Koehler (2017), Minhat et al. (2017), and Mussi et al. (2016).
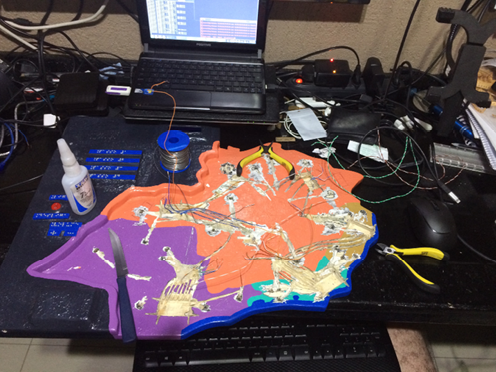
Figure 1 - Installation of Sensors on the CEMT Touch Map.
Source: Personal file.
The entire process of building the CEMT Map was based on the use of the techniques that were evaluated and which are widely used by researchers / professors who have been working in the process of including people with visual impairments for years. As a basis in this process, we use design concepts, exposed by Norman (2006), with the intention of seeking beauty, the playful appearance of a game, visual comfort, intuitive use, the best arrangement of tactile symbols, the disposition of your sensors and their connectors.
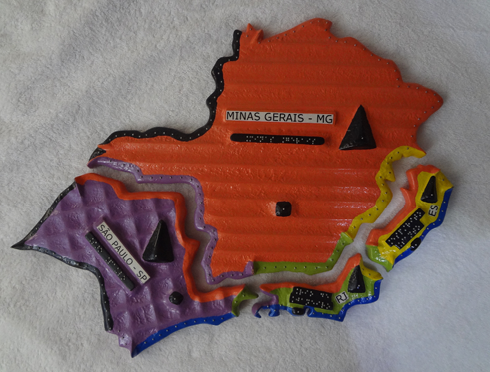
Figure 2 - CEMT Touch Map.
Source: Personal file.
The design of the CEMT map, figure 2, proposes an environment for dialogue with the student, because when manipulating the map, the stimulus generated by his touch, coming from his sensors, is immediately answered. For each stimulus, the CEMT Map performs an audio description referring to the characteristics of the sensor that was invoked and the indication of the next step to be followed by that student, this occurs from the beginning to the end of their interaction / study with the CEMT Map, assigning it logical meaning, as explained by Piaget (1978) when he says that: “To assimilate a sensory picture or an object either by simple assimilation or by generalized words, assign a meaning to it ”(Piaget, 1978, p. 183).
Thus, as proved in the research by Arruda (2016), Alexandrakis (2016) and Brule et al. (2016) and Minhat et al. (2017) who added sensory functionalities to their tactile maps to stimulate the other senses (in the case of the CEMT Map the touch added to that of hearing) to sharpen the students’ instincts to explore the information on the tactile map in a playful and intuitive way.
This complete process begins when the teacher prepares the student to know the CEMT Map, after the recognition of the six tactile maps the student turns on the CEMT Map to start his study of the Southeast Region of Brazil.
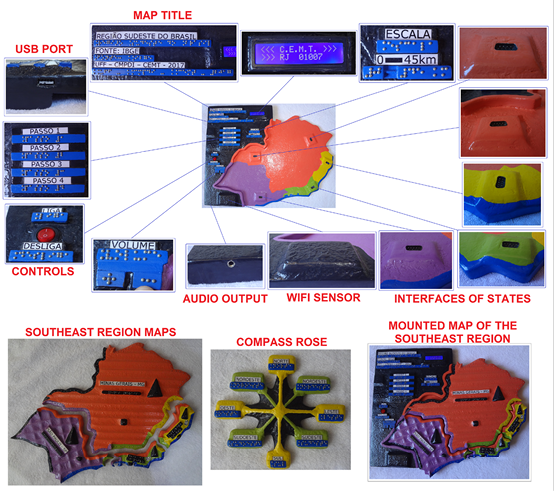
Figure 3 - Tactile map CEMT and its components.
Source: Personal file.
When the tactile map is turned on, the CEMT Map Prototype starts its introductory speech, executing the file “001.mp3” added by the teacher to present the CEMT Map to the student and passes the initial operating instructions, including the volume control procedure which can be adjusted at any time during the study. The components of the CEMT Map are shown in figure 3.
The CEMT map has a set of inserts, a compass rose, USB port (for copying audio files and charging the internal battery), Braille and text writing components. When the Student passes his finger through the Braille script, the map talks to the student giving various information about a certain state in the Southeast Region. In this way, the Blind Student can get a sense of the relief, space, layout, cardinal coordinates and how the Southeast Region is structured on the map. When a piece is connected to another, the map talks to the student informing geographic data of the new state connected to the Southeast Region.
The CEMT map has a computer embedded in its construction which aims to guarantee the student a material of high technological quality. The map is programmed to provide an interaction initiated with the student’s touch on one of its forty-six tactile sensors. This form of construction guarantees simplicity in its usability, which would be quite complex if the map were interconnected to a personal computer.
3.1 The CEMT evaluation process
The validation of the CEMT Experimental Prototype follows the process shown in figures 4a and 4b. As can be seen in figure 4a, in the validation model, the entire process starts with research at IBC and has six steps.
We see that the Experimental Prototype of the CEMT Map is only validated by the geography teacher, here labeled “Participating Professor 01”, if he has approved the prototype proposal and does not report any possibility of improvement to be incorporated into the map.
In the possibility of the participant pointing out a requirement that is unworkable to the project, the researcher must register the same and justify his inability to meet it. We finalized the methodology to be followed for validation of the Experimental Prototype of the CEMT Map and we describe below, how to perform the validation to be conducted by the listening student, labeled here as “Participating Student 01”, with visual impairment at IBC.
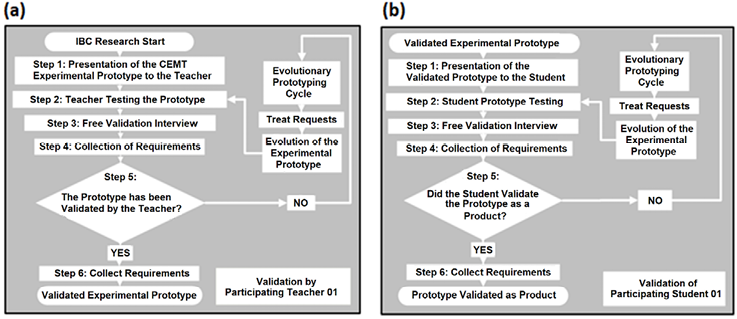
Figure 4 - Validation flowchart - Participating Professor and Student.
Source: Personal file.
The validation process conducted by Participating Student 01, can only be started after the validation of the Experimental Prototype of the CEMT Map conducted by Participating Teacher 01, figure 4b.
As the second member of this research, Participating Student 01, a student at the Benjamin Constant Institute from the sixth to the ninth grade, aged 11 to 17, volunteering for the experiment with the consent of his guardian and with the signed informed consent form, had already studied the theme of Geography on the characteristics of the Southeast Region of Brazil.
In addition to the related requirements, Participating Student 01 must be:
• listener.
• have low vision (may be mild, moderate, or severe).
• and know how to read in the Braille system.
This process aims to validate the Experimental Prototype of the CEMT Map in all its functionalities and characteristics aimed at visual impairment.
Participating Student 01 must use and know the said prototype, so that he can naturally expose all the necessary requirements for evolutionary prototyping, allowing his evolution and validation of an experimental prototype for a final product ready to be evaluated.
We can see in figure 4b that the model of the student’s validation process starts with the validation of the experimental prototype that was conducted by the Participating Professor 01 in six steps.
The CEMT Map Experimental Prototype is only validated as a product, if Participating Student 01 has approved the prototype proposal and does not report any possibility of improvement to be incorporated into the map.
3.2 Result of the evaluation of the Product by the IBC Teachers and Students
The validation process of the CEMT Map was conducted with the Participating Professor 01 who validated, accompanied us throughout the research at IBC and two more Geography professors from IBC itself as volunteers.
The evaluation conducted by the Participating Teachers was conducted individually, but in this section, we present the results of all participants.
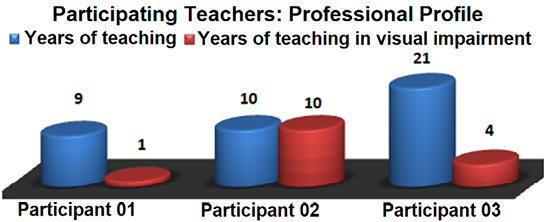
First, the researcher sought to know the profile of the Participating Teachers of the IBC in relation to their experiences as teachers and in teaching aimed at visually impaired students. We can analyze the profiles, looking at figure 5.
Participating Professor 01 despite nine years of teaching practice he is the most novice in teaching visually impaired students among his peers, Participating Professor 02 is the most experienced teacher of visually impaired students and Participating Professor 03, the most experienced teacher and despite working in the classroom for more than two decades he has four years as a teacher of visually impaired students.
We observed a diversity of experiences among the teachers, each Participating Teacher recorded the evaluation points related to the Product of the CEMT Map that seeks to contribute to the education of hearing students with visual impairments.
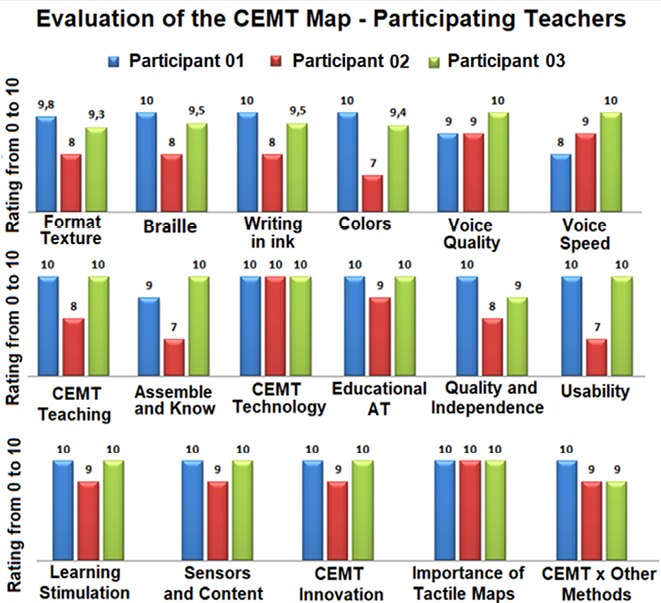
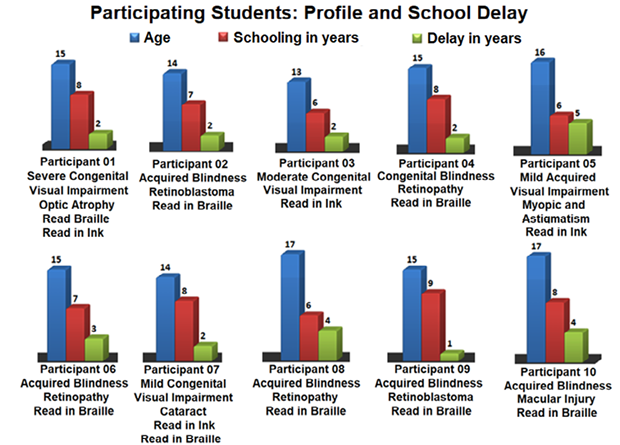
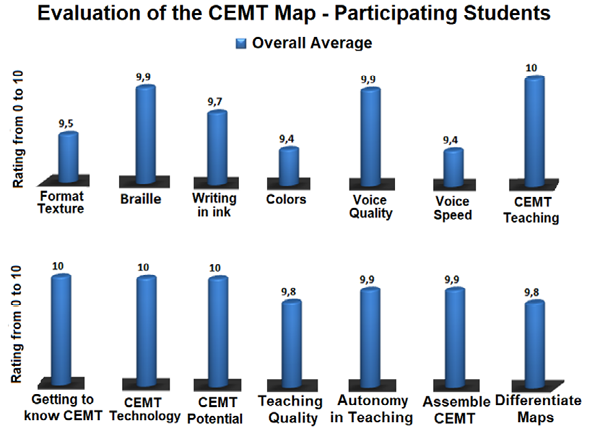
Figure 5 - Profile of Participating Teachers at IBC. Source: Personal file. All teachers evaluated the potential of the CEMT Map, and the researcher demonstrated how the CEMT Map can be modified by the Teacher using the USB port connected to the computer. Figure 6 allows us to view all the items that have been evaluated with IBC teachers and different profiles related to their teaching practice. Figure 6 - Summary of the Evaluation of the CEMT Map - Participating Teachers. Source: Personal file. The process, in this last phase of the research, of evaluating the product of the CEMT Map was composed of the participation of Participating Student 01 who validated the prototype of the CEMT Map as a product and another 09 Participating Students who were also volunteers in this research. In figure 7, we can analyze the profile of these ten Participating Students who were volunteers in the research and who evaluated the CEMT Map at IBC, we present their characteristics, such as: age, education, school delay, type of visual impairment, whether it was congenital or acquired and the cause which led the Student to become a hearing person with visual impairment. Figure 7 - Profile / School delay of Participating Students. Source: Personal file. We can see in Figure 7 that Participating Listening Students with visual impairment have as a cause, varied factors, pathologies that have been acquired or genetic. Recalling the words of Nogueira (2016) it is important to ascertain the three possibilities of visual impairment: seeing poorly; not seeing but having already seen; and never have seen. It is these characteristics that we must know and their specificities when working with the methods that will assist in the inclusion of these people. The age profile ranged from thirteen to seventeen years, addressing mild, moderate and severe congenital or acquired low vision, followed by congenital or acquired blindness, in addition to a school delay presented in an initial level of two to five years. The researcher presented the CEMT Map to each of the Participating Students, individually, explaining the details of the map through their tactile symbols, textures, colors, in short, their characteristics and features. The ten Participating Students accessed the potential of the CEMT Map product, that is, each of its six tactile maps, evaluated the product by simulating a class on the theme of the Southeast Region of Brazil, listened to the proposal of its content and activated all its sensors, following the four steps of the proposed study. Following our research methodology, we made a systematic non-participating observation with each Participating Student who manipulated the CEMT map, where the researcher raised the requirements on how the students interacted with the CEMT Map. In figure 8 we conduct a general evaluation average of the CEMT Map on the grades awarded by all Participating Students in its fourteen items and we can see that in a general check the CEMT Map was very well evaluated, with grades that varied from 9.4 to the maximum score that was grade 10. Figure 8 - Evaluation of the CEMT Map - Participating Students - General Average. Source: Personal file. These results were produced through structured interviews from closed questionnaires on the characteristics and functionalities of the CEMT Map, and through semi-structured interviews, being conducted so that Participating Students justified their grades applied to each evaluative item on the CEMT Map that were scored with grades below 9. With the realization of a material and functional search on tactile maps through a search in the academic bases, where we selected research that gave us useful information about the best practices, use of materials, the main functionalities and how to produce tactile maps that meet the specificities of hearing people with visual impairment with low / moderate / severe low vision or blindness, whether acquired or congenital. We built an experimental computational prototype, using the components shipped by the Arduino Platform, in the construction of hardware, in a tactile map and will address the characteristics of the Southeast Region of Brazil. We apply it in practice and make the most of the concepts acquired during the bibliographic survey that allowed us to create a more refined and higher quality prototype in its design, providing a gain in research in relation to the time of execution in the field (occurred in the IBC facilities) and in the conception of an extremely high level of maturity that we can make possible in the elaboration of this prototype. And finally, we validated the experimental prototype of the CEMT Map as a product that includes the hearing student with visual impairment in the teaching and learning process, executing the procedures to achieve a better performance of the students in the teaching / learning process. The CEMT Map is an educational tool and we found in the presentation of the evaluative results of the CEMT Map that the three Geography Teachers and the ten hearing students with visual impairment and with the most diverse specificities (low / moderate or severe vision can be acquired or congenital and congenital or acquired blindness) evaluated the CEMT Map very well. The three Participating Teachers closed the issue in the contribution of the CEMT map in relation to their proposal to promote autonomy and increase quality, being a tool that facilitates the teaching and learning process of hearing students with visual impairments. Materializing this affirmative in numbers, we have twenty-seven items asked to Participating Teachers about the characteristics of the CEMT Map, on a grade scale from 0 to 10 and a possible total of 270 points, the average grade given by teachers was 244, 67 points, with a 90.6% improvement in its characteristics. In the opinion of the Participating Teachers, among the items asked about the characteristics of the CEMT Map, all items obtained a percentage of points loss, and the item of colors of the CEMT Map were the ones that lost the most points (3%), followed by texture (2%), Braille / ink writing (1.85%), voice speed (0.37%) and finally the voice quality (0.25%). In the assessment for the functionalities of the CEMT Map, eleven items were asked and of the 110 possible points, the map obtained 104 points, reaching a higher approval rate of 94.54%. The ten hearing students with visual impairment who were divided into four categories due to their specificities and after knowing and using the CEMT Map all Participating Students answered questions related to the items of the characteristics and functionalities of the CEMT Map. The numerical results presented by the Participating Students point out that of the 270 possible points in the evaluation of the characteristics of the CEMT Map, they scored the map by 261.97 points, representing a 97% pass rate in this evaluation. When evaluating the functionalities of the CEMT Map, in the eighty possible points, the CEMT Map was evaluated with 79.4 points, reaching an impressive percentage of 99.25% of use in the evaluation of its functions. In a numerical comparison and in general, the CEMT Map was much better evaluated in its characteristics and functions by the Participating Students (97% - 99.25%) than by the Participating Teachers (90.6% - 94.54%) in this search. It was latent, in our research, that it was much more difficult to meet the specificities of hearing students with visual impairment of low vision than of students with visual impairment with blindness. Listening students with visual impairment with low vision, even due to their numerous specificities, were much more demanding when it came to the design of the CEMT Map in relation to its colors, the quality of the ink writing, shapes, and presentation of the map design. Hearing students with visual impairment of acquired and congenital blindness took great care in the quality of the writing in the Braille system, in the textures, in the details of the tactile symbols and in the formats of each of the six tactile maps that make up the CEMT Map Product. Listening students with visual impairment of congenital blindness drew the researcher’s attention, as they all expressed feelings of surprise compared to the states of the Southeast in terms of size and weight in relation to the striking differences in the territorial area of Minas Gerais in relation to the state São Paulo and even more in relation to the area of Rio de Janeiro and Espírito Santo. About the states of Rio de Janeiro and Espírito Santo how much they are similar in size, weight, and shape. The group of students who presented the easiest were the hearing students with visual impairment with low vision, as they completed their studies with the CEMT Map in just 29% more time than the researcher needed to perform the same action. The listener student with visual impairment with moderate low vision concluded, in second place, taking 44% more time in his study than the researcher. The hearing student with visual impairment with severe low vision needed 71% more than the time the researcher completed his study on the Southeast Region of Brazil. Members of the group of students with visual impairment of acquired blindness used 85% more of the time the researcher needed to complete their studies with the CEMT Map. The students who presented more difficulties were the ones who were part of the group of hearing students with visual impairment of congenital blindness, as they needed more than twice the time (116%) that the researcher needed to study the contents of the Southeast Region. We observed that the higher the level of visual impairment of these students, the greater their difficulties, the research pointed out that although they need more time, compared to those who have a healthy vision, everyone can perform the proposed tasks, proving that the challenge of visual impairment is in the transposition of these barriers and not in the cognitive / intellectual impairment. The researchers needed to work with personalized approaches, to be successful and with the intention of providing an environment of safe and friendly interaction during their interventions with each participating student, even though they had a methodology to be applied to all student participants in this research. In the middle of the group of hearing students with visual impairment of low low vision, we had a student who is also color blind and who rated the colors of the CEMT Map with an average of 8.5 for being confused with the lilac color we painted in the State of São Paulo with the blue color used to paint the São Paulo coast. In this example, we conclude that the colors that we apply to the tactile maps will not always suit everyone satisfactorily. Therefore, we must provide the student who has this barrier, complementary information to make him understand the contents exposed through these maps. The voice quality of the CEMT Map is not robotized and is close to human speech, providing students with greater hearing comfort. The speed of the voice used on the maps can influence the quality of the students’ studies, as we realize that hearing students with visual impairments who have access to and mastery of digital technologies of screen readers and cell phones prefer a faster level of voice in their studies, that is, your ears are trained to assimilate more information in less time. There are also students who have not trained in this technique and need a less accelerated voice level to be able to follow their studies. 4. Conclusion This research proved that we could develop more evolved Assistive Technologies by appropriating computational concepts and showed the importance in its use for the design of projects that can include people who are visually impaired listeners. Embedded computing was used to manage the communication between the sensors of the CEMT Map using as an example the study of the content of the political map of the Southeast Region of Brazil. Tactile maps are widely used in this inclusive process, and we have developed a technology that modified its design with the intention of making them more functional, efficient, attractive to add value and provide greater quality in teaching / learning and more autonomy in the studies of children. hearing impaired people, in addition to better equipping Geography teachers to succeed in developing their academic activities with these students. The investigative and development process of this design counted on the active collaboration that included the Participating Teachers with the Participating Students that integrate the school community of the Benjamin Constant Institute in the process of validating and evaluating the product of the CEMT Map. The design of the CEMT Map proposes a very playful, intuitive, interactive format and allows the student to learn in play, creating a two-way link between the student and the CEMT Map, allowing them to study more interesting and less tiring. The CEMT Map also allowed students who have mastered the principle of the map to be able to autonomously start, resume, review and complete their studies without any assistance. The CEMT Map was pointed out by teachers and students as an educational tool with potential in its characteristics and features that are endowed by inclusive projects that have universal designs, as this map can be used by all, hearing students with visual impairments or not. We present a very flexible Assistive Technology proposal for teachers who can modify / update the contents of the CEMT Map whenever they deem necessary, proving that the map will never be obsolete and will always be available to better serve students in their academic studies. The research leaves as a legacy, a concrete example for the development of new Assistive Technologies, making use of computational concepts that provide more technical support to teachers and that facilitates the teaching / learning process of their hearing students with visual impairments. The construction and development of Assistive Technologies with a high technological degree is not intended to replace teaching activities, but to propose more effective and efficient tools in promoting a more productive teaching and learning environment for its students. References Alexandrakis, V. (2016). A participatory approach to the development of specifications for a 3D puzzle for visually impaired and sighted users. 103f. Dissertation (Master of Science) - Royal Institute of Technology in Stockholm. Stockholm, 2016. Recuperate of: https://bit.ly/3qtDu6J Alves, D. A., Alencar, A. C. M. & Bezerra, H. C. J. (2016). A cartografia tátil como recurso didático para inclusão de deficientes visuais nas aulas de geografia: breves considerações. In: II Congresso Internacional de Educação Inclusiva e III jornada chilena brasileira de educação inclusiva. Campina Grande - PB, 2016. Anais... Pernambuco: Realize. p. 1-12. Recuperate of: https://bit.ly/2YuSfdG Amiralian, M. T. (1997). Compreendendo o cego. São Paulo: Casa do Psicólogo, Arruda, L. M. S. (2016). Geografia na infância para discentes com deficiência visual: a utilização de uma maquete multissensorial para a aprendizagem do conceito de paisagem. Giramundo, 3(5), 93-101. Recuperate of: https://bit.ly/3BXShZf Bem, G. M. de (2016). Parâmetros de fabricação de símbolos de mapas táteis arquitetónicos. 204f. Dissertação (mestre em arquitetura e Urbanismo) Universidade de Santa Catarina. Recuperate of: https://bit.ly/3zepgLa Bersch, R. (2017). Introdução a tecnologia assistiva. Tecnologia e educação: Porto Alegre, p. 1-20. Recuperate of: https://bit.ly/3klaREA Brandão, J. (2009). Vivenciando a Matemática. São Paulo: Scortercci, Brasil. Lei nº 9.394, de 20 de dezembro de 1996. Estabelece as diretrizes e bases da educação nacional. Diário Oficial da União. Recuperate of: https://bit.ly/3D8Ad08 Brasil. Decreto nº 3.298, de 20 de dezembro de 1999. Regulamenta a Lei no 7.853, de 24 de outubro de 1989, dispõe sobre a Política Nacional para a Integração da Pessoa Portadora de Deficiência, consolida as normas de proteção, e dá outras providências. Diário Oficial da União. Recuperate of: https://bit.ly/3D0rAVi Brasil. Lei nº 13.146, de 06 de julho de 2015. Institui a Lei Brasileira de Inclusão da Pessoa com Deficiência (Estatuto da Pessoa com Deficiência). Diário Oficial da União. Recuperate of: https://bit.ly/3C0qx6n Brule, E., Bailly, G., Brock, A., Valentin, F., Denis, G. & Jouffrais, C. (2016, May). MapSense: multi-sensory interactive maps for children living with visual impairments. Proceedings of the 2016 CHI conference on human factors in computing systems (pp. ٤٤٥-٤٥٧). https://doi.org/10.1145/2858036.2858375 Cenci, C. A. & Bernardi, N. (2016). Maquetes Táteis produzidas a partir de Técnicas de Fabricação Digital: investigação de simbologia para orientação espacial de deficientes visuais. In: VI Encontro Nacional De Ergonomia do Ambiente Construído & VII Seminário Brasileiro de Acessibilidade Integral, 2., 2016, Salvador. Anais... São Paulo: Bluche, p.248-259. Recuperate of: https://bit.ly/3C0Pi2c. Cook, A.M. & Hussey, S. M. (1995). Assistive Technologies: Principles and Practices. St. Louis, Missouri. Mosby – Yearbook, Degreas, H. N. & Katakura, P. (2016). Mapas táteis: orientação e mobilidade em ambiente urbano. Revista Brasileira de Cartografia, 68(8), 1-18. Recuperate of: https://bit.ly/3C0J3LX Figueiredo, J. R. M. (2014). O presente pelo passado: variação verbal em narrativas de deficientes visuais. Rio de Janeiro: Instituto Benjamin Constant. Recuperate of: https://bit.ly/3CXnZqS Figueiredo, J. R. M. (2017). Deficiência Visual: Desafios para a Educação Inclusiva. Seminário de Educação Cruz Alta/RS, 5(1), 35-36, Recuperate of: https://bit.ly/3qsWSAN . Giorgos, M. (2017). Research, study, design, and production of a tactile map, created by 3d printing technology, to cater the people with partial or total blindness in the interactive park and the citadel of Leivithra. 46f. Dissertation (Master of Science (MSc) in Strategic Product Design) -Internacional Hellenic University, Thessaloniki – Greece, 2017. Recuperate of: https://bit.ly/3BZ551p Koehler, K. E. (2017). Examining the Conceptual Understandings of Geoscience Concepts of Students with Visual Impairments: Implications of 3-D Printing. Doctor (Doctor of Philosophy)- Graduate School of The Ohio State University, Ohio. Recuperate of: https://bit.ly/3n10MPd Lima, P. C. & Fonseca, L. P. (2016). Recursos táteis adaptados ou construídos para o ensino de deficientes visuais. In: XIII Congresso brasileiro de ensino superior à distância e II Congresso internacional de educação superior a distância. São João Del Rei- MG, 2016. Anais... São João Del Rei, p. ١-١٥. Recuperate of: https://bit.ly/3okkLb4 Lynn, L. E. (1980). Designing Public Policy: a Cas e-book on the Role of Policy Analysis. Santa Monica, Calif.: Goodyear. Marconi, M. A. & Lakatos, E. M. (2011). Fundamentos de metodologia científica. 6. ed. São Paulo: Atlas. Mead, L. (1995). Public policy: vision, potential, limits. Policy Currents (Newsletter of the Public Policy Section, APSA), 68(3). Minhat, M., Abdullah, N. L., Idrus, R. & Keikhosrokiani, P. (2017, May). TacTalk: Talking tactile map for the visually impaired. In 2017 8th International Conference on Information Technology (ICIT) (pp. 475-481). IEEE. https://doi.org/10.1109/ICITECH.2017.8080045 Mussi, A. Q., Romanini, A., Lantelme, E. & Martins, M. S. (2016). Arquitetura inclusiva: a planta tátil como instrumento de projeto colaborativo com portadores de deficiência visual. In Congreso de la Sociedad Iberoamericana de Gráfica Digital (Vol. ٢٠, pp. ٣٨٧-٣٩٣). Recuperate of: https://bit.ly/3wvmiP8 Nogueira, R. E. (Org.). (2016). Geografia e inclusão escolar teoria e práticas. Florianópolis: Edições do bosque. Recuperate of: https://bit.ly/3kmCM7a Normandi, D. (2016). Design para acessibilidade: inclusão de pessoas com deficiência visual ao serviço de cinema. 353 f. Dissertação (mestrado em Arquitetura) -Faculdade de Arquitetura e Urbanismo da Universidade de São Paulo, São Paulo. Recuperate of: https://bit.ly/3wyGFe9 Oliveira, T. T. R. (2016). Estudo sobre a percepção acerca de aspectos geomorfológicos da paisagem pelo indivíduo com deficiência visual. 79 f. Dissertação (mestrado em Geografia) – Universidade Federal de Santa Maria, Santa Maria, RS, 2016. Recuperate of: https://bit.ly/30dHo8V ONU (1990). Declaração Mundial sobre Educação para Todos: satisfação das necessidades básicas de aprendizagem. Jomtien, Tailândia. Recuperate of: https://bit.ly/3EYKmwP ONU (1994). Declaração de Salamanca: Sobre Princípios, Políticas e Práticas na Área das Necessidades Educativas Especiais. Salamanca, Espanha. Recuperate of: https://bit.ly/3oWDXNQ Peters, B. G. (1986). American Public Policy. Chatham, N.J.: Chatham House. Piaget (1978). O Nascimento da Inteligência da Criança. Rio de Janeiro: Zahar. Pressman, R. S. (2011). Engenharia de Software: uma abordagem profissional. 7ª ed. Porto Alegre: McGrawHill. Silva, K. C. & Rocha, M. L. da. (2016). A cartografia tátil na educação escolar. In: III Congresso de Ensino, Pesquisa e Extensão da UEG. Inovação: Inclusão Social e Direitos, v.3., 2016, Pirenópolis - Goiás. Anais... Pirenópolis, CEPE, p. 1-5. Recuperate of: https://bit.ly/3F7SVWh Silva, P. A. (2017). O estudo da organização e representação espacial de discentes cegos para o ensino de conceitos cartográficos. São João Del Rei – MG. 2017. 171 f. Dissertação (mestre em Geografia) - Universidade Federal de São João Del Rei, 2017. Recuperate of: https://bit.ly/3F1wMIV Sommerville, Ian (2011). Engenharia de Software. 9.ed. São Paulo: Pearson, Stampach, R. & Mulickova, E. (2016). Automated generation of tactile maps. Journal of Maps, 12(S1), 532–540. https://doi.org/10.1080/17445647.2016.1196622 Vivarta, V. (Coord.) (2003). Mídia e deficiência. Diversidade, 2. Andi; Fundação Banco do Brasil. Recuperate of: https://bit.ly/3C1p7sj